
|
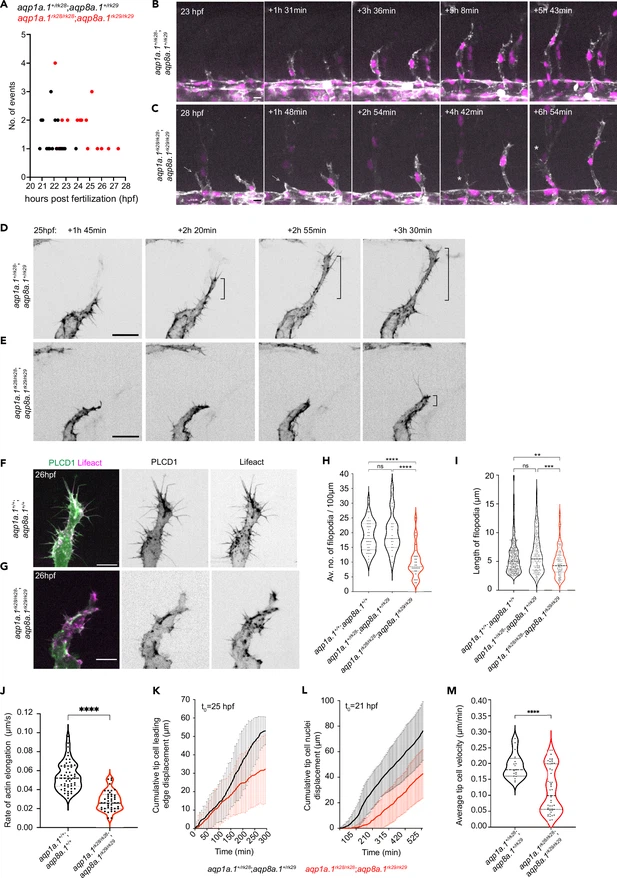
Fig. 4 Aquaporins promote endothelial tip cell protrusion and migration. (A) Timing of tip cell emergence from the dorsal aorta (DA) in aqp1a.1+/rk28;aqp8a.1+/rk29 (n = 23 cells) and aqp1a.1rk28/rk28;aqp8a.1rk29/rk29 (n = 27 cells). (B, C) Still images from time-lapse imaging of migrating tip cells from aqp1a.1+/rk28;aqp8a.1+/rk29 (B) and aqp1a.1rk28/rk28;aqp8a.1rk29/rk29 (C) embryos from 20 hpf to 30 hpf. White arrows, retracting tip cell. *, secondary sprouting from posterior cardinal vein (PCV). Scale bar, 10 µm. (D, E) Stills images from representative time-lapse movies of migrating tip cells in aqp1a.1+/rk28;aqp8a.1+/rk29 (D, n = 2) and aqp1a.1rk28/rk28;aqp8a.1rk29/rk29 (E, n = 5) embryos. Movies were taken from 25 hpf to 30 hpf (n = 2 independent experiments). Bracket, formation of stable protrusions. Scale bar, 20 µm. (F, G) Representative maximum intensity projection confocal z-stacks of tip cells from wildtype (F) and aqp1a.1rk28/rk28;aqp8a.1rk29/rk29 (G) embryos at 26 hpf. Scale bar, 10 µm. (H) Quantification of filopodia number in tip cells of wildtype (n = 36 cells from 10 embryos, two independent experiments), aqp1a.1+/rk28;aqp8a.1+/rk29 (n = 19 cells from six embryos, two independent experiments), and aqp1a.1rk28/rk28;aqp8a.1rk29/rk29 (n = 28 cells from nine embryos, two independent experiments) embryos. (I) Quantification of filopodia length in tip cells of wildtype (n = 24 cells from seven embryos, two independent experiments), aqp1a.1+/rk28;aqp8a.1+/rk29 (n = 16 cells from seven embryos, two independent experiments), and aqp1a.1rk28/rk28;aqp8a.1rk29/rk29 (n = 11 cells from six embryos, two independent experiments) embryos. (J) Growth rate of actin bundles in tip cell filopodia in 25 hpf wildtype (n = 12 cells from seven embryos, two independent experiments) and aqp1a.1rk28;aqp8a.1rk29 (n = 12 cells from six embryos, two independent experiments) embryos. (K) Quantification of tip cell leading edge displacement of aqp1a.1+/rk28;aqp8a.1+/rk29 (n = 19 cells from five embryos, three independent experiments) and aqp1a.1rk28/rk28;aqp8a.1rk29/rk29 (n = 47 cells from 13 embryos, six independent experiments) embryos at 25–30 hpf; data is presented as mean ± SD. (L) Quantification of tip cell nuclei displacement of aqp1a.1+/rk28;aqp8a.1+/rk29 (n = 20 cells from six embryos, four independent experiments) and aqp1a.1rk28/rk28;aqp8a.1rk29/rk29 (n = 20 cells from four embryos, two independent experiments) embryos at 21–30 hpf; data is presented as mean ± SD. (M) Quantification of tip cell migration velocity in aqp1a.1+/rk28;aqp8a.1+/rk29 (n = 19 cells from five embryos, three independent experiments) and aqp1a.1rk28/rk28;aqp8a.1rk29/rk29 (n = 47 cells from 13 embryos, six independent experiments) embryos at 25–30 hpf. Statistical significance was determined by Brown–Forsythe and Welch ANOVA tests with Dunnett’s (H) or Sidak’s (I) multiple-comparisons test, and with unpaired t-test (J, M). ns, p>0.05, **p<0.01, ***p<0.001, and ****p<0.0001.