
|
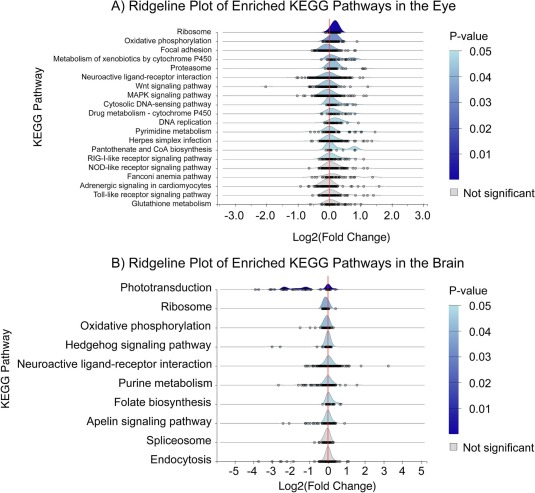
Fig. 10 A) KEGG pathways enriched using gene set enrichment analysis of mutant vs wildtype eyes (raw p-values with 0.05 cutoff, n=10, GSEA). Each point under the curve represents an individual gene and its fold change. There were 15 perturbed pathways when considering raw p-value, however only the top two were significant when considering adj. p-value. B) KEGG pathways enriched using a gene set enrichment analysis of mutant vs wildtype brains (raw p-values with 0.05 cutoff, n= 10 & 8 respectively, GSEA). Each point under the curve represents an individual gene and its fold change. There were eight perturbed pathways when considering raw p-value, however only the top three were significant when considering adj. p-value.