
|
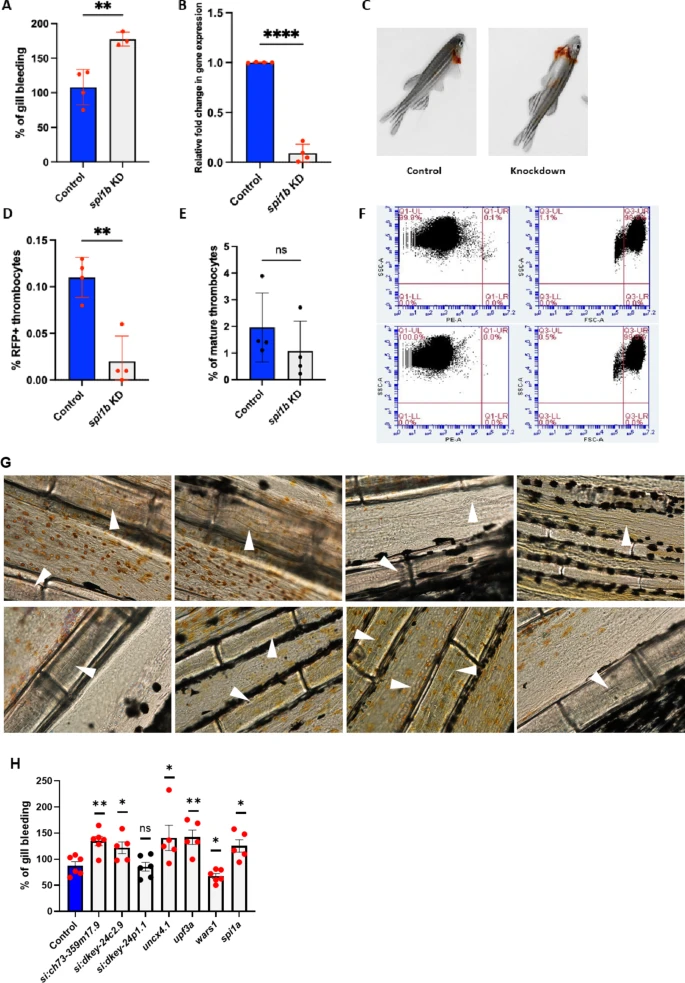
Fig. 3 Gill bleeding and quantification of young and mature thrombocytes in spi1b knockdown zebrafish. Gill bleeding in spi1b knockdown fish and confirmation of knockdown by qRT-PCR. (A) Knockdown of spi1b in adult zebrafish and estimation of the extent of bleeding. NaOH-induced gill bleeding was photographed, and the red pixel intensities in the photograph measured the bleeding extent. The percentage of gill bleeding of WT controls is represented by blue bars, while spi1b knockdown is represented by grey bars. 3–4 fish were used for KD sample and control experiments (N = 3–4). (B) The spi1b were knocked down, and the RNA from the liver and spleen were reverse transcribed and subjected to qRT-PCR, and the fold change of gene expression was calculated in wild-type (WT) controls (blue bars) and knockdown (KD) samples (grey bars). Four fish were used for KD and control experiments (N = 4). (C) Representative images showing gill bleeding in wild-type control and the knockdown fish. (D) Quantification of young RFP+ thrombocyte percentages from flow cytometric data in spi1b knockdown adult GloFish whole blood compared to control wild-type (WT) fish. (E) Mature thrombocyte percentages derived from total and RFP + thrombocyte percentages in spi1b knockdown adult GloFish whole blood compared to control WT fish. WT controls are represented by blue bars, while KDs are depicted as grey bars. Four fish were utilized for spi1b KD and control experiments (N = 4). (F) Top and bottom panels show representative dot plots illustrating the percentage of RFP + thrombocytes and the total thrombocytes in whole blood in WT controls and spi1b KD, respectively. The PE-A, SSC-A (Side Scattering), and FSC-A (Forward Scattering) channels are indicated on the respective axes. The Q1-UR in left panels (upper right quadrangle) and Q3-UL in right panels (upper left quadrangle) show the RFP + young and total thrombocyte percentages, respectively. The cells in other quadrangles represent other blood cells. Gating is shown by red lines and is drawn according to the fluorescence intensity of thrombocytes in the PE-A channel and the size in right panel. (G) Representative blood vessels in the tails of WT control (top panels) and spi1b KD (bottom panels) zebrafish, respectively, are shown. Arrowheads show the vessels in the tail region. (H) Knockdown of seven genes in adult zebrafish and estimation of the extent of bleeding. The percentage of gill bleeding in WT control is represented by blue bar, while the knockdown of other genes is represented by grey bars. 5–6 fish were used for KD sample and control experiments (N = 5–6). For A, B, D, E and H, the lines on the top of the bars represent a significant difference between WT and KD samples. Statistical analysis was performed using Student’s t-test. Error bars represent mean ± SD. **, and **** represent p ≤ 0.01 and p ≤ 0.0001, respectively. A p-value < 0.05 was considered significant, and a p > 0.05 was taken as non-significant (ns).