
|
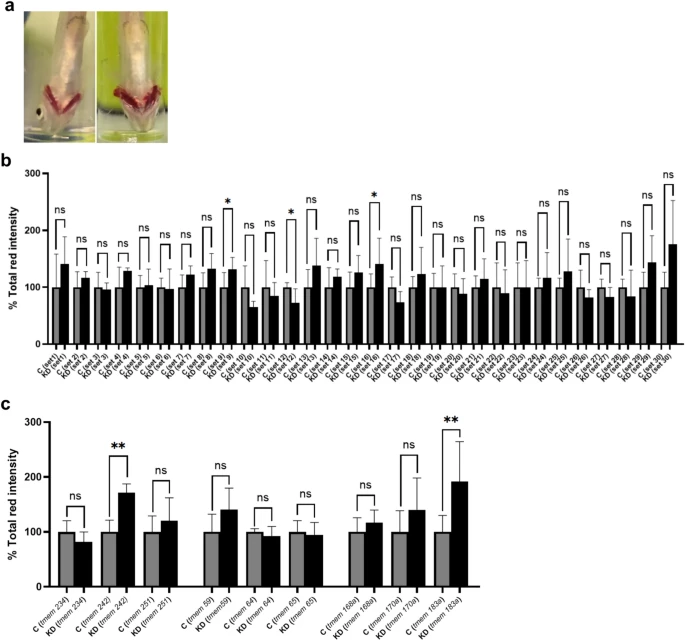
Fig. 1 Screening of tmems found in zebrafish thrombocytes using gill bleeding assay. Both control (C) and tmems knockdown (KD) zebrafish were subjected to the gill bleeding assay (n = 6). (a) Images of gill bleeding in KD zebrafish on the right compared to the control zebrafish on the left. Note greater gill bleeding in KD zebrafish. (b) Bar graph showing knockdown of tmems within the 30 sets. The quantification of total red intensity emanating from red pixels observed in the control zebrafish is compared with KD zebrafish. Each gene set is evaluated within its respective control and KD groups. (c) Bar graph illustrating the individual gene knockdowns within sets 9, 12, and 16. Error bars, mean ± s.d. P values were calculated by Student’s t-test. *P < 0.05 and **P < 0.01; ns not significant.