IMAGE

Figure 4

ID
ZDB-IMAGE-250110-48
Source
Figures for Vassalli et al., 2024
Image
Figure Caption

Figure 4

Cell proliferation and apoptosis assays on zebrafish
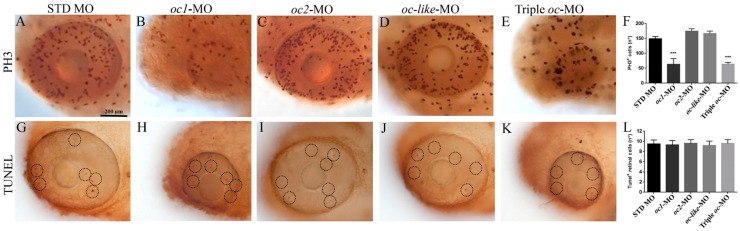
 oc morphant retinal cells. (AE) Immunostaining for the mitotic marker PH3 in (A) Eye of control embryo injected with STD MO and (BE) of embryos injected with oc1, oc2, oc-like and triple oc-MO. (F) Graphical analysis of proliferating cells in oc1, oc2, oc-like and triple oc-MO embryos at 24 hpf with respect to STD MO embryos. (GL) Tunel assay showing no significant differences in the number of apoptotic cells (black circles) between control (G) and oc1, oc2, oc-like and triple oc-MO eyes (HK). (L) Graphical analysis of the number of apoptotic cells observed in (GK) retinas. Data are expressed as mean ± SEM. Non parametric Kruskal–Wallis test with Dunn’s post hoc correction. *** p < 0.001.

Acknowledgments
This image is the copyrighted work of the attributed author or publisher, and ZFIN has permission only to display this image to its users. Additional permissions should be obtained from the applicable author or publisher of the image. Full text @ Cells