IMAGE

Fig. 3.

ID
ZDB-IMAGE-241218-84
Source
Figures for Siddiqui et al., 2024
Image
Figure Caption

Fig. 3.

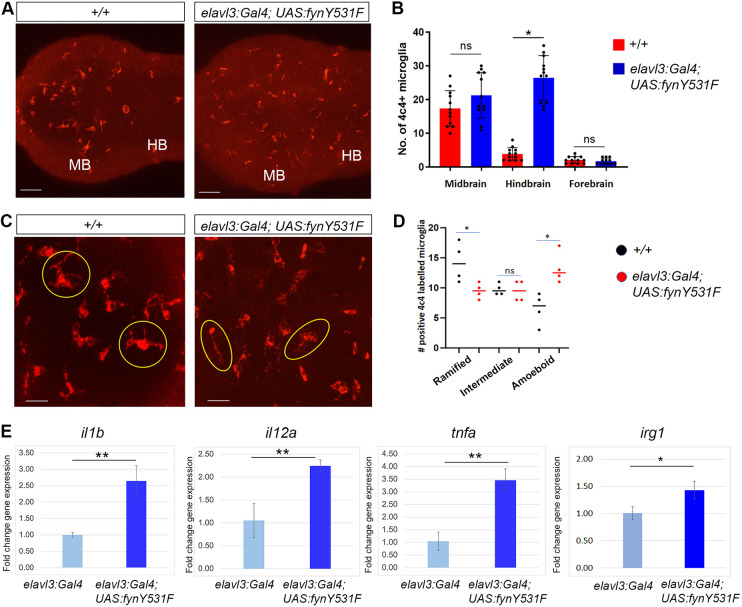
Zebrafish neural FynY531F overexpression drives microglia activation and cytokine induction. (A) 4C4 immunolabeling of microglia in wild-type +/+ and elavl3:Gal4; UAS:fynY531F forebrain and midbrain (MB)/hindbrain (HB). (B) Quantification of 4C4-labeled microglia in 5 dpf +/+ and elavl3:Gal4; UAS:fynY531F larval brain (n=12). (C) Higher-magnification images of 4C4-labeled microglia in +/+ and elavl3:Gal4; UAS:fynY531F larvae. Yellow circles outline microglia with ramified morphology; yellow ovals outline microglia with intermediate or amoeboid morphology. (D) Quantification of microglia with ramified, intermediate and amoeboid morphologies in 5 dpf +/+ and elavl3:Gal4; UAS:fynY531F larval brain (n=4). (E) Reverse transcription quantitative PCR (RT-qPCR) of il1b, il12a, tnfa and irg1 in RNA extracts from control elavl3:Gal4 and elavl3:Gal4; UAS:fynY531F 5 dpf larvae (n=3 biological replicates for each genotype). Statistical analysis was performed with two-tailed unpaired Student’s t-test. Bars represent mean±s.e.m. ns, not significant; *P<0.05; **P<0.01. Scale bars: 50 µm (A); 20 µm (C).

Acknowledgments
This image is the copyrighted work of the attributed author or publisher, and ZFIN has permission only to display this image to its users. Additional permissions should be obtained from the applicable author or publisher of the image. Full text @ Dis. Model. Mech.