
Image
|
Figure Caption
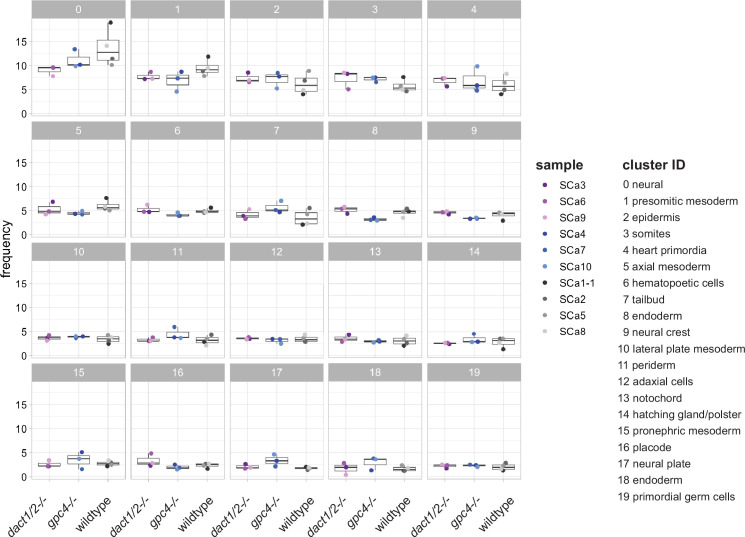
Figure 6—figure supplement 1. Cluster abundance across genotype groups.
Scatter box plots showing the frequency of each identified cell cluster between
Acknowledgments
This image is the copyrighted work of the attributed author or publisher, and
ZFIN has permission only to display this image to its users.
Additional permissions should be obtained from the applicable author or publisher of the image.
Full text @ Elife