IMAGE

Figure 4.

ID
ZDB-IMAGE-241122-17
Source
Figures for Carroll et al., 2024
Image
Figure Caption

Figure 4. 
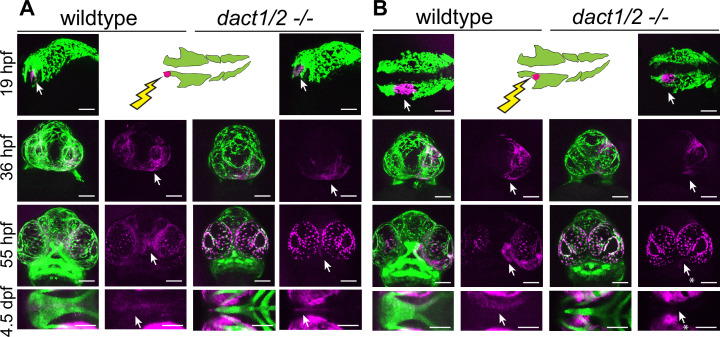
Anterior neural crest cells of the dact1/2−/− mutant migrate to the midline and populate the dysmorphic ethmoid plate.

Lineage tracing of wildtype and dact1/2−/− double mutant zebrafish embryos using Tg(sox10:kaede) line. sox10:kaede fluorescence is shown in green and photo-converted kaede is shown in magenta and highlighted with an arrow. Asterisks indicate that the cell population is absent. (A, B) 19 hpf embryo sagittal views showing photoconversion of anterior-most neural crest population. At 36 hpf frontal images show the migration of photoconverted neural crest cells to the frontal prominence in wildtype and dact1/2−/− double mutants. At 55 hpf, frontal images show photoconverted neural crest cells populating the region of the developing anterior neurocranium (ANC) in wildtype and dact1/2−/− mutants. At 4.5 dpf ventral images show photoconverted neural crest cells populating the medial ethmoid plate in wildtype. Similarly, neural crest cells in dact1/2−/− mutants populate the rod-shaped ethmoid plate. Scale bar: 100 μm. Representative images of three individual experiments.

Acknowledgments
This image is the copyrighted work of the attributed author or publisher, and ZFIN has permission only to display this image to its users. Additional permissions should be obtained from the applicable author or publisher of the image. Full text @ Elife