IMAGE

Fig. 1

ID
ZDB-IMAGE-241119-86
Source
Figures for Morales Fénero et al., 2024
Image
Figure Caption

Fig. 1

Effect of light exposure in the expression of
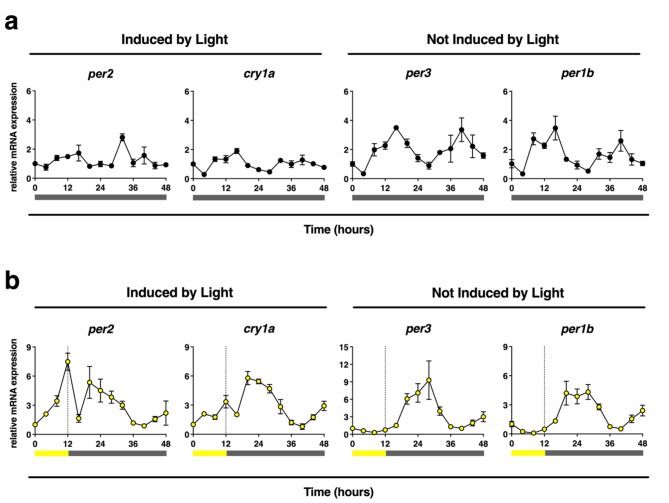
 per2, cry1a, per3, and per1b on Z3 cells. (a) Z3 cells were entrained for three LD cycles of 12:12 h. After the third day of entrainment, cells were exposed to constant darkness (DDDD) and mRNA expression of the genes per2, cry1a, per3, and per1b were analyzed every 4 h for 48 h. The eJTK test detected circadian rhythmicity on per3 and per1b, with a p-value of 0.01. No rhythmicity was detected in per2 and cry1a in DDDD. (b) mRNA expression of the genes per2, cry1a, per3 and per1b after a 12-hour exposure of low-intensity light (~ 4.12 × 1018 photons/s/m2) with subsequent darkness (LDDD). Samples were taken every 4 h for 48 h. Transcript levels were measured against time zero. Yellow bar: light exposure. Grey bar: constant darkness. Means ± SD are shown. Three replicates per group, one experiment.

Acknowledgments
This image is the copyrighted work of the attributed author or publisher, and ZFIN has permission only to display this image to its users. Additional permissions should be obtained from the applicable author or publisher of the image. Full text @ Sci. Rep.