IMAGE

Fig. 2

ID
ZDB-IMAGE-241119-108
Source
Figures for Kapp et al., 2024
Image
Figure Caption

Fig. 2

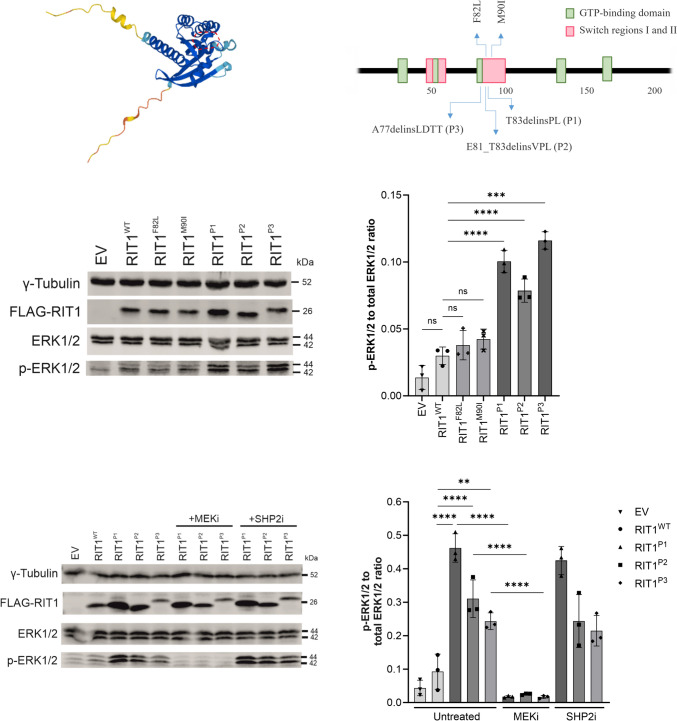
ERK phosphorylation after expression of RIT1 variants in vitro in HEK293T cells. a Protein structure of RIT1 predicted by AlphaFold, accessed through ensemble.org. The area labelled by the dashed red line indicates the switch 2 domain. b Schematic drawing of RIT1 functional domains of human RIT1 protein (green boxes = GTP-binding regions; red boxes = switch domain 1 and 2; blue arrows (upward) = two mutations typically found in Noonan syndrome; blue arrows (downward) = mutations identified in P1-P3. c Western blot after expression of RIT1 variants to assess RAS-MAPK pathway activation. Gamma tubulin served as loading control, FLAG-RIT1 confirms the expression of the construct, total ERK levels serve as a control to exclude the differential expression of ERK, and p-ERK measures the level of phosphorylate of ERK as a marker of RAS pathway activation. d Quantification of the ERK phosphorylation was measured in a total of three western blots for each variant (n = 3). One-way ANOVA. P value ***< 0.001; ****< 0.0001, ns = not significant. Data are presented as mean ± SD. EV = empty vector. e Western blot after expression of RIT1 variants and with or without treatment using a MEK inhibitor or SHP2 inhibitor. The same parameters were assessed as in panel d. f Quantification of the ERK phosphorylation was measured in a total of three western blots for each variant (n = 3). One-way ANOVA. P value **< 0.01; ****< 0.0001, ns = not significant. Data are presented as mean ± SD

Acknowledgments
This image is the copyrighted work of the attributed author or publisher, and ZFIN has permission only to display this image to its users. Additional permissions should be obtained from the applicable author or publisher of the image. Full text @ Angiogenesis