IMAGE

Figure 1.

ID
ZDB-IMAGE-241115-83
Source
Figures for Ono et al., 2024
Image
Figure Caption

Figure 1. 
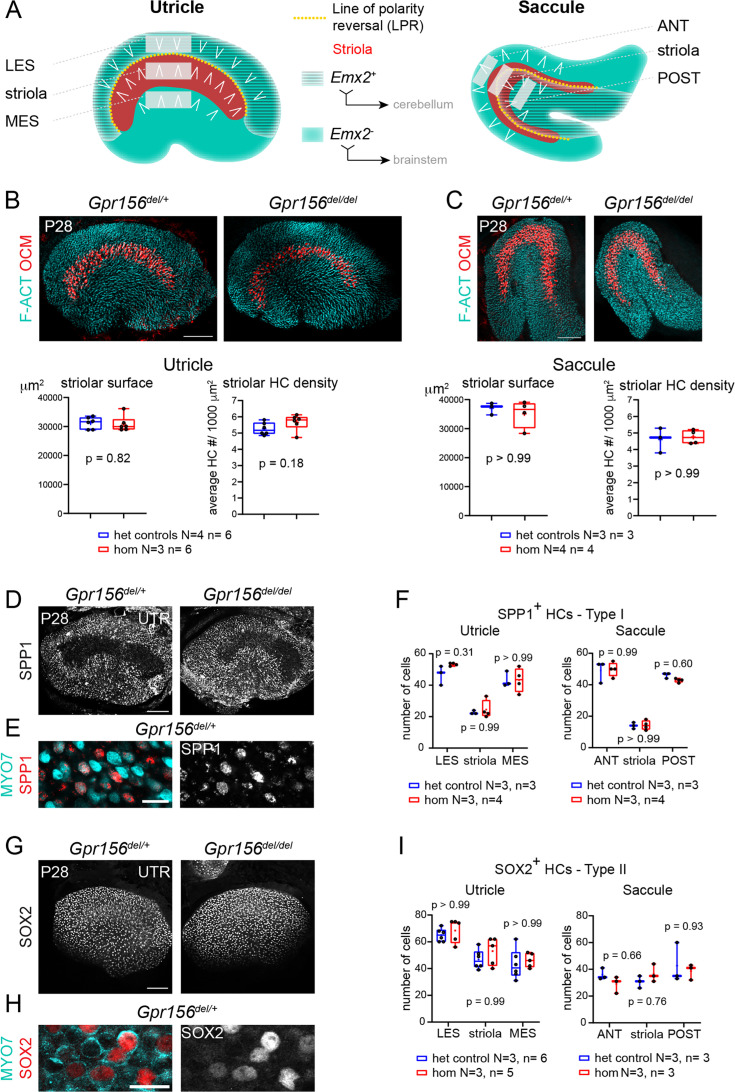
Normal striola and hair cell type organization in Gpr156 mutants.

(A) Diagrams showing general macular organization and the regions analyzed in (B–I) (LES, MES: lateral and medial extrastriola, respectively; ANT: anterior, POST: posterior). Each region is 130x50 µm in the utricle and 150x40 µm in the saccule. White chevrons indicate HC orientation. (B–C) P28 utricles (B) and saccules (C) immunolabeled with oncomodulin (OCM) to reveal the striolar region and phalloidin to reveal F-actin (F-ACT)-rich hair bundles. Graphs report striolar surface area and striolar HC density based on OCM labeling and show no change in mutants compared to heterozygote littermate controls. All points are graphed along with 25–75% boxplots (external bars: minimum and maximum, internal bar: median, cross: mean). Mann-Whitney U test. (D–F) P28 maculae immunolabeled with SPP1 to reveal type I HCs. Low magnification of the utricle (D), high magnification view showing SPP1 at the utricle HC neck (E), and quantification per region in utricle and saccule (F). (G–I) P28 maculae immunolabeled with SOX2 to reveal type II HCs. Low magnification of the utricle (G), high magnification view showing SOX2 in the utricle HC nucleus (H), and quantification per region in utricle and saccule (I). (F), (I): Two-way ANOVA with Sidak’s multiple comparisons. N, n: number of animals and HCs, respectively. UTR, utricle. Scale bars: 100 µm (B–C, D, G), 10 µm (E, H).

Acknowledgments
This image is the copyrighted work of the attributed author or publisher, and ZFIN has permission only to display this image to its users. Additional permissions should be obtained from the applicable author or publisher of the image. Full text @ Elife