
|
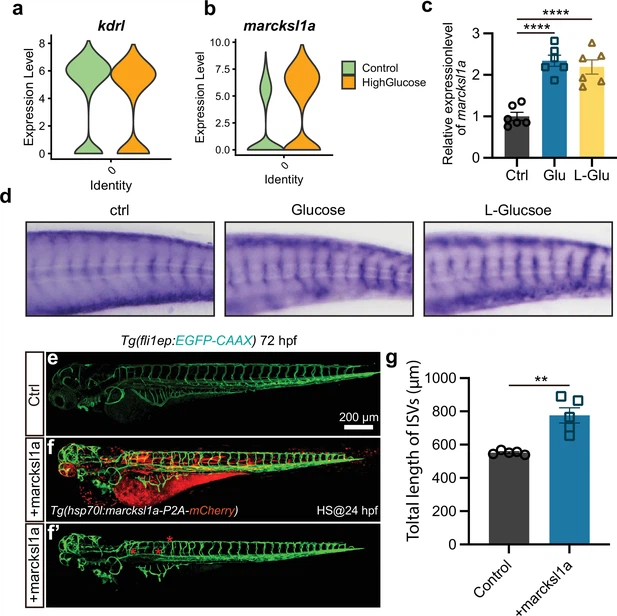
Fig. 7 Marcksl1a overexpression induced excessive angiogenesis in zebrafish embryos. (a) The violin plot of endothelial cells (ECs) marker gene kdrl of control and high glucose group in arterial and capillary ECs. (b) The violin plot of gene marcksl1a of control and high glucose group in arterial and capillary ECs. (c) Real-time PCR analysis of marcksl1a expression in control, high glucose-, and high L-glucose-treated embryos (n=6). t-test, ****p<0.0001. (d) Whole-mount in situ hybridization analysis of marcksl1a in control, high glucose, and high L-glucose-treated embryos. (e–f’) Confocal imaging analysis of blood vessels in control and hsp70l:marcksl1a-P2A-mCherry-injected Tg(fli1aEP:EGFP-CAAX)ntu666 embryos. (g) Statistical analysis of the total length of intersegmental vessels (ISVs) in control and hsp70l:marcksl1a-P2A-mCherry-injected embryos (n=5). t-test, **p<0.01.