
Image
|
Figure Caption
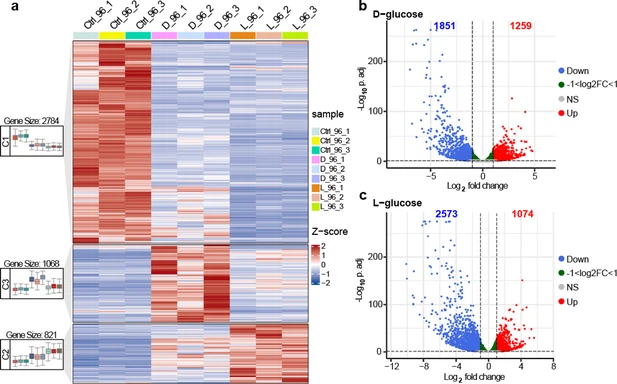
Fig. 4 - Supplemental 3 Transcriptome sequencing analysis of control, high D-glucose-, and high L-glucose-treated embryos. (a) The heatmap of differentially expressed genes (DEGs). (b) Volcano map of DEGs after high D-glucose treatment. (c) Volcano map of DEGs after high L-glucose treatment.
Acknowledgments
This image is the copyrighted work of the attributed author or publisher, and
ZFIN has permission only to display this image to its users.
Additional permissions should be obtained from the applicable author or publisher of the image.
Full text @ Elife