
|
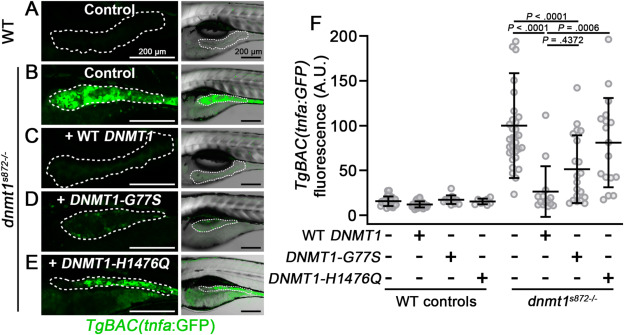
Fig. 6 Functional analysis of rare DNMT1 variants in a zebrafish dnmt1 mutant model. (A–E) Live confocal imaging of TgBAC(tnfa:GFP) in 5 dpf dnmt1s872 mutant larvae and WT siblings. 1-cell stage embryos were injected with cRNA encoding WT or variant DNMT1, raised to 5 dpf, imaged, and then genotyped. Dotted line demarcates the anterior intestinal epithelium. Right panels show GFP overlayed with brightfield images. Scale bars are 200 μm. (F) Quantification of tnfa:GFP intensity in the anterior intestinal epithelium from experiments in panels A–E. Mean ± SD are plotted. P values were calculated using 2-way ANOVA. Data points are mean pixel intensity values from individual larvae (n ≥ 8 larvae per group). ANOVA, analysis of variance; GFP, green fluorescent protein; SD, standard deviation.