
|
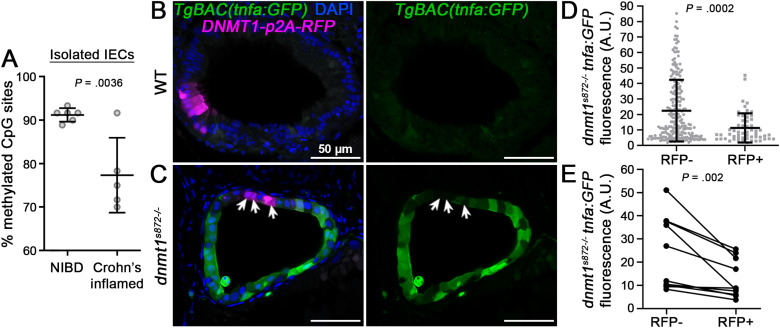
Fig. 5 TNF hypomethylation of IECs is associated with inflammation and increased IEC TNF expression. (A) TNF methylation analysis of FACS isolated IECs obtained from bowel resections of non-IBD (NIBD) controls and inflamed CD cases. Data points are average methylation values from individual cases and controls (NIBD, n = 6 samples; Crohn’s inflamed, n = 5 samples). Mean ± SD are plotted. (B and C) 1-cell stage dnmt1s872 zebrafish mutants and WT siblings expressing TgBAC(tnfa:GFP)pd1028 as an inflammation reporter were injected with transgenic constructs to mosaically express human DNMT1-p2A-RFP specifically in IECs. At 5 days postfertilization (dpf), transverse sections of the intestine were collected and imaged by confocal microscopy. Arrows point to sparsely labeled RFP + cells expressing DNMT1 in dnmt1s872 mutants. Scale bars are 50 μm. (D) Quantification of tnfa:GFP expression in dnmt1s872 mutants (n = 217 [RFP-] and 57 [RFP+] IECs from 10 larvae). Mean ± SD are plotted. (E) Quantification of tnfa:GFP expression in dnmt1s872 mutants from paired RFP- and RFP+ IECs from individual tissue sections (n = 10 larvae). P values were calculated using nonparametric Wilcoxon 2-sample tests (A and D) or a Wilcoxon matched-pairs signed rank test (E). CD, Crohn’s disease; FACS, fluorescence-activated cell sorting; IBD, inflammatory bowel disease; IECs, intestinal epithelial cells; SD, standard deviation; TNF, tumor necrosis factor.