
|
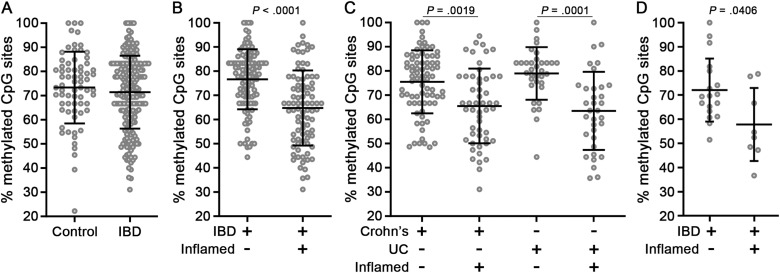
Fig. 2 Inflamed mucosa of IBD cases exhibit TNF hypomethylation. (A) Methylation analysis of the TNF promoter from mucosa of controls (n = 69 samples from 67 donors) and IBD cases (n = 199 samples from 133 donors). (B) IBD cases were stratified according to biopsy inflammation status (uninflamed, n = 112 samples; inflamed, n = 87 samples). (C) IBD cases were stratified according to disease subtype and biopsy inflammation status (CD uninflamed, n = 77 samples; CD inflamed, n = 52 samples; UC uninflamed, n = 34 samples; UC inflamed, n = 34 samples). (D) Methylation analysis of an independent cohort of IBD cases (n = 26 samples from 15 donors) obtained from a separate study site. Data points are average methylation values for individual biopsies. Mean ± SD are plotted. P values were calculated using nonparametric Wilcoxon 2-sample tests (A, B, and D) or a nonparametric Kruskal-Wallis H test (C). CD, Crohn’s disease; IBD, inflammatory bowel disease; SD, standard deviation; TNF, tumor necrosis factor; UC, ulcerative colitis.