
|
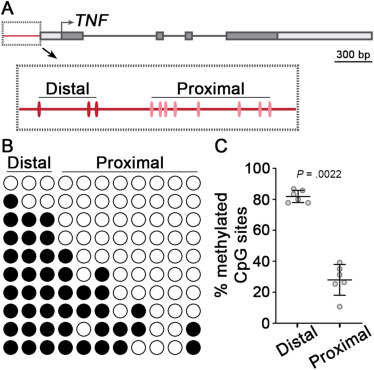
Fig. 1 Methylation analysis of the TNF promoter from healthy human colon mucosa. (A) Schematic of the human TNF gene. CpG sites of the promoter region (red line) are shown in the boxed inset. (B) Methylation analysis of the TNF promoter from healthy human colon using targeted bisulfite sequencing. Columns represent individual CpG sites, and rows are 10 sequencing replicates for a single donor. Filled circles are methylated CpG sites, while open circles are nonmethylated. (C) Quantification of methylation analysis from healthy human colon. Individual data points are average methylation values (n = 6 samples each). Mean ± SD are plotted. P value was calculated using a nonparametric Wilcoxon 2-sample test. CpG, Cytosine-phosphate-Guanine; SD, standard deviation; TNF, tumor necrosis factor.