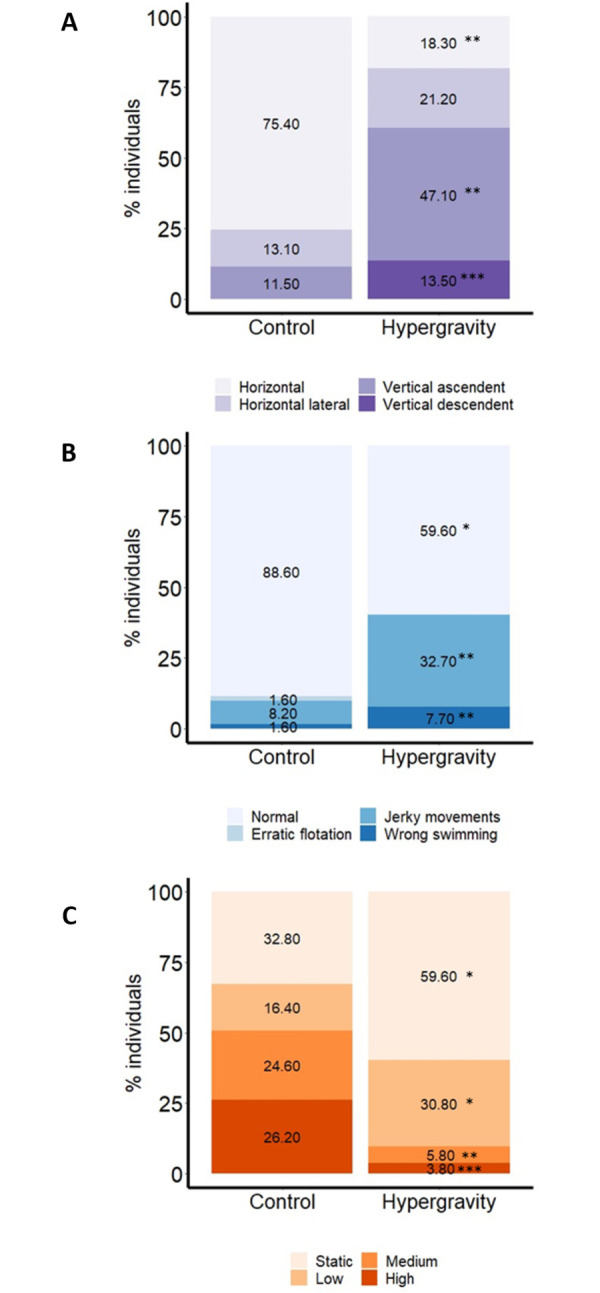
Ethogram analysis consisted on identifying three locomotor characteristics: Position (A), movement frequency (B) and swimming behavior (C) of larvae of zebrafish at 5 days post fertilization (dpf). Bar graphs representing the percentage of individuals in control and hypergravity conditions. Six biological replicates were observed with a total number of 90 individuals in the hypergravity group and 90 in the control. The different colors represent the assessed features in each parameter. The data are presented as percentages of individuals. To evaluate significant differences, we performed a Chi-square test. * = P < 0.05; ** = P < 0.01; *** = P < 0.001.
Acknowledgments
This image is the copyrighted work of the attributed author or publisher, and
ZFIN has permission only to display this image to its users.
Additional permissions should be obtained from the applicable author or publisher of the image.
Full text @ PLoS One
Your Input Welcome
Thank you for submitting comments. Your input has been emailed to ZFIN curators who may contact you if
additional information is required.
Oops. Something went wrong. Please try again later.