IMAGE

Fig. 2

ID
ZDB-IMAGE-240308-8
Source
Figures for Koparir et al., 2024
Image
Figure Caption

Fig. 2

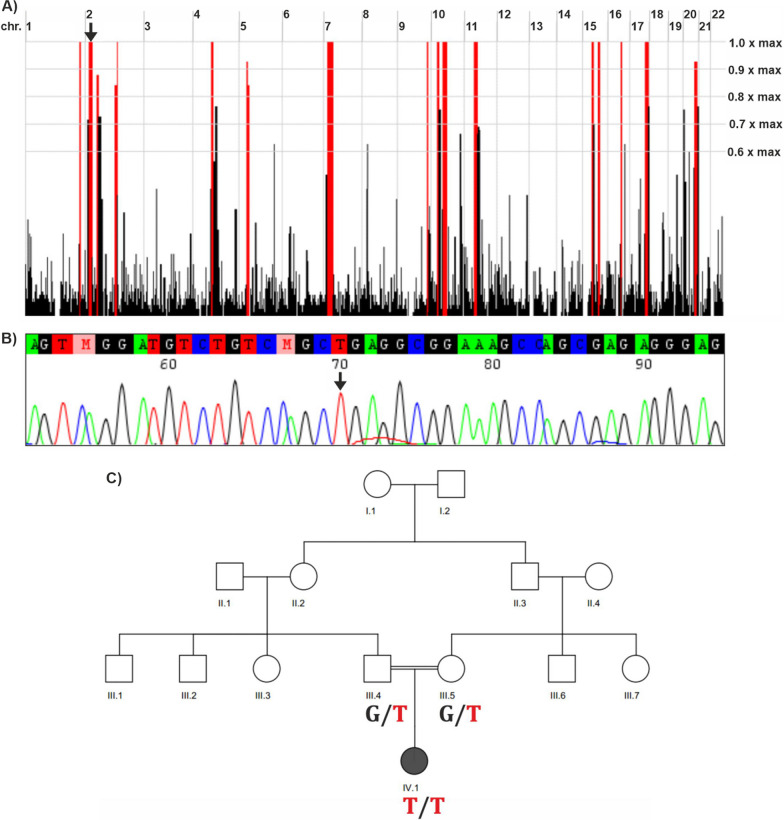
Genetic results of the family. A Homozygous intervals in the patient’s genome, as determined by HomozygosityMapper. MSGN1 resides in a ~ 13.2 Mb homozygous interval on chromosome 2 (black arrow). B Sanger sequencing electropherogram of the patient’s variant in MSGN1. The mutated base is indicated by a black arrow. C Segregation of the MSGN1 variant within the family

Acknowledgments
This image is the copyrighted work of the attributed author or publisher, and ZFIN has permission only to display this image to its users. Additional permissions should be obtained from the applicable author or publisher of the image. Full text @ Hum. Genomics