
|
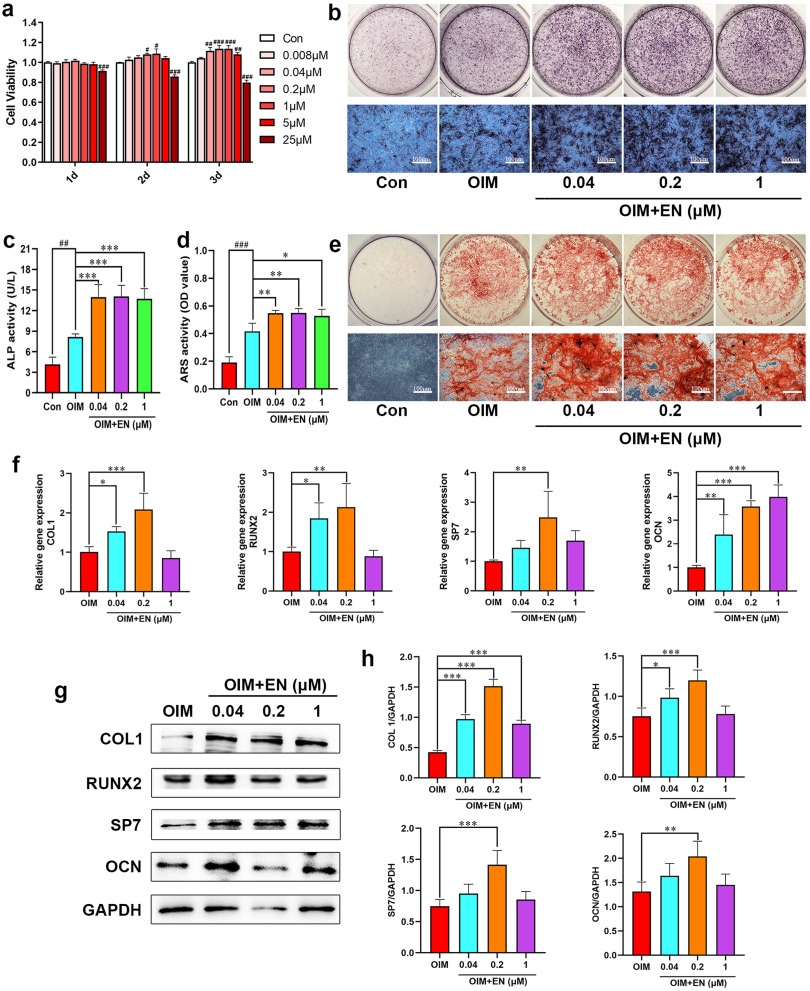
Fig. 5 Effects of EN on cell proliferation and osteogenic differentiation in C3H10 cells. (a) Viability of C3H10 cells treated with EN at different concentrations (0.008–25 μM). (b–c) ALP staining and activity assays were measured after treating C3H10 cells with EN (0.04, 0.2, and 1 μM) for 7 days. (d–e) ARS staining and activity assays were performed after 21 days. (f) The mRNA expression levels of osteoblast-related genes (COL1, RUNX2, SP7, and OCN) in C3H10 cells were detected on day 10. (g–h) The protein expression levels of COL1, RUNX2, SP7, and OCN were detected by western blotting on day 10. #P < 0.05, ##P < 0.01, ###P < 0.001 vs. Con; ∗P < 0.05, ∗∗P < 0.01, ∗∗∗P < 0.001 vs. OIM. The data are shown as the means ± SD (n = 3). Scale bar: 100 μm. EN, eurycomanone; C3H10 cells, mouse mesenchymal stem cell line; ALP, alkaline phosphatase; ARS, alizarin red S; COL1, collagen type I; RUNX2, runt-related transcription factor 2; SP7, Sp7 transcription factor; OCN, osteocalcin; Con, Control; OIM, osteogenic induction medium. (For interpretation of the references to colour in this figure legend, the reader is referred to the Web version of this article.)