IMAGE

Fig. 6

ID
ZDB-IMAGE-230817-20
Source
Figures for García-López et al., 2023
Image
Figure Caption

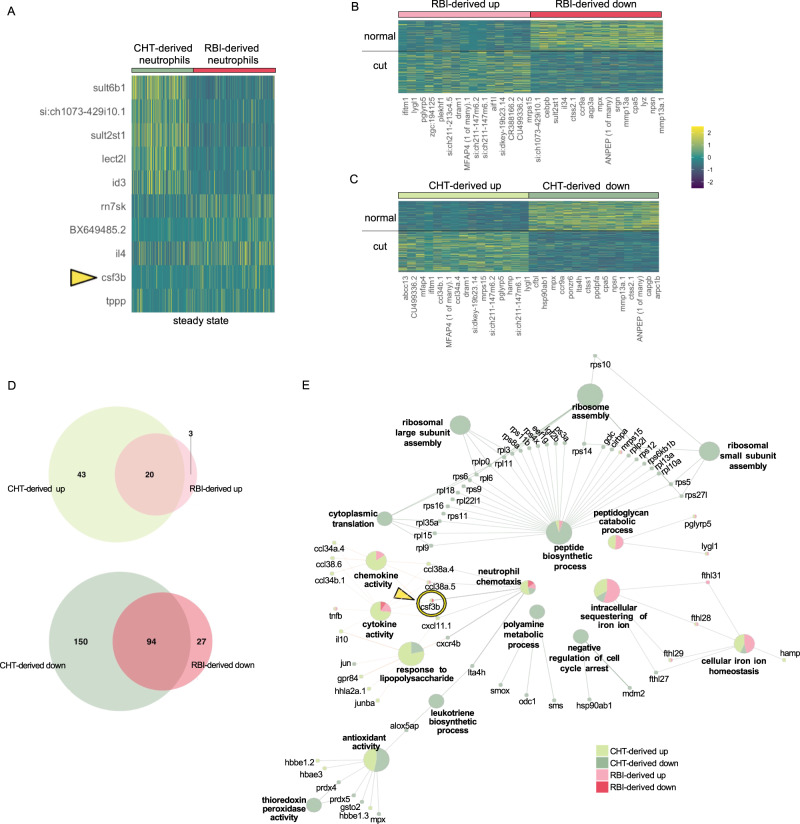
Fig. 6 RBI- and CHT-derived neutrophils have different responses to resection.

A Heatmap of the top 5 markers in primitive and definitive neutrophils at steady state (complete list available in Supplementary Data 2, filtered on a minimum detection fraction threshold = 0.1, log fold-change threshold = 0.25 and p-value < 0.05 (not adjusted), negative binomial test, out of the 2000 most variable genes, only genes with positive fold change were selected). B, C Heatmaps of the top 15 upregulated and downregulated genes upon tail resection among the RBI- derived (B) and CHT-derived (C) neutrophil populations (complete list available in Supplementary Data 3 and 4, filtered on a minimum detection fraction threshold = 0.1, log fold-change threshold = 0.25 and p-value < 0.05 (not adjusted), negative binomial test, out of the 2000 most variable genes, only genes with positive fold change were selected). D Venn diagram showing the number of overlapping upregulated and downregulated genes between RBI-derived and CHT-derived neutrophils. E Network of the pathways associated with upregulated and downregulated genes among RBI-derived and CHT-derived neutrophils upon tail resection. Each gene associated with a given pathway is displayed. Pie charts indicated the relative contribution of each type of neutrophil to that term/gene (see Methods). Note that csf3b appears both as associated with chemotaxis upon resection and as a specific marker of the RBI-derived neutrophils when compared with CHT-derived neutrophils. Heatmaps show genes with p-value < 0.05, based on a negative binomial distribution, out of the 2000 most variable genes.

Acknowledgments
This image is the copyrighted work of the attributed author or publisher, and ZFIN has permission only to display this image to its users. Additional permissions should be obtained from the applicable author or publisher of the image. Full text @ Nat. Commun.