IMAGE

Figure 8

ID
ZDB-IMAGE-230619-28
Source
Figures for Fleischhauer et al., 2023
Image
Figure Caption

Figure 8

Wnt signaling in the skin of zebrafish.
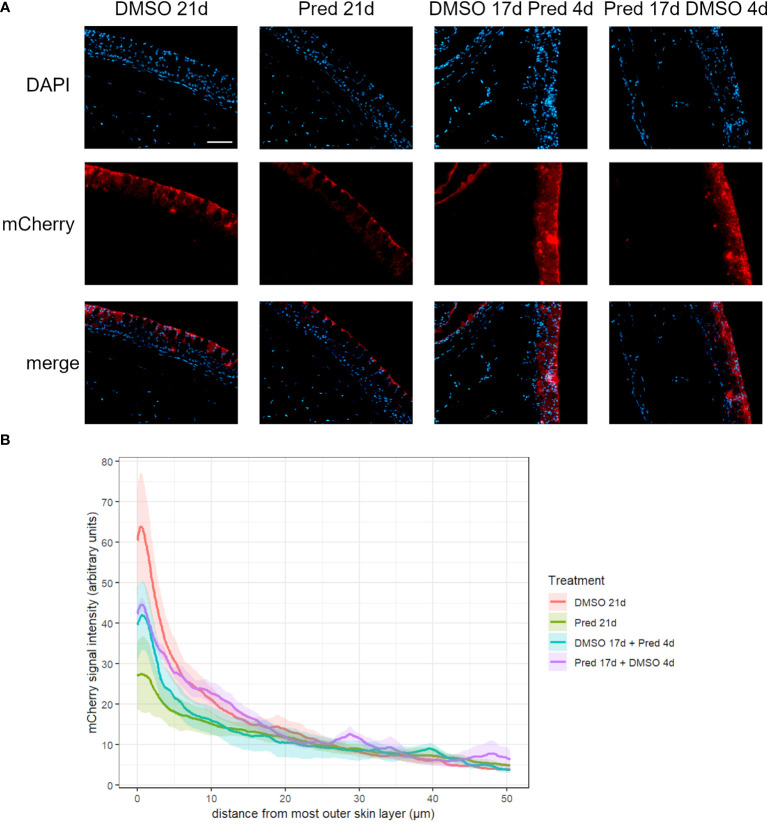
 (A) Immunohistochemical staining against the Wnt-reporter mCherry and nuclear counterstain with DAPI. From left to right: fish underwent 21 days of DMSO, 21 days of prednisolone, 17 days of DMSO followed by 4 days of prednisolone and 17 days of prednisolone followed by 4 days of DMSO treatment. Scalebar 50 µm. (B) Quantification of the 7xTCF-Xia.Siam:nlsmCherry Wnt reporter expression in the skin. Lines represent mean ± SEM of mCherry signal intensity for fish that underwent 21 days of DMSO, 21 days prednisolone, 17 days DMSO followed by 4 days prednisolone and 17 days of prednisolone followed by 4 days of DMSO treatment. Signal was measured from the outermost layer towards the inner layers of the skin. Average skin thickness is around 50 µm. n=5 (4 females, 1 male in DMSO 21d, DMSO 17d Pred 4d, Pred 17 d DMSO 4d; 5 females in Pred 21d) in all groups with 2 sections per individual.

Acknowledgments
This image is the copyrighted work of the attributed author or publisher, and ZFIN has permission only to display this image to its users. Additional permissions should be obtained from the applicable author or publisher of the image. Full text @ Front Endocrinol (Lausanne)