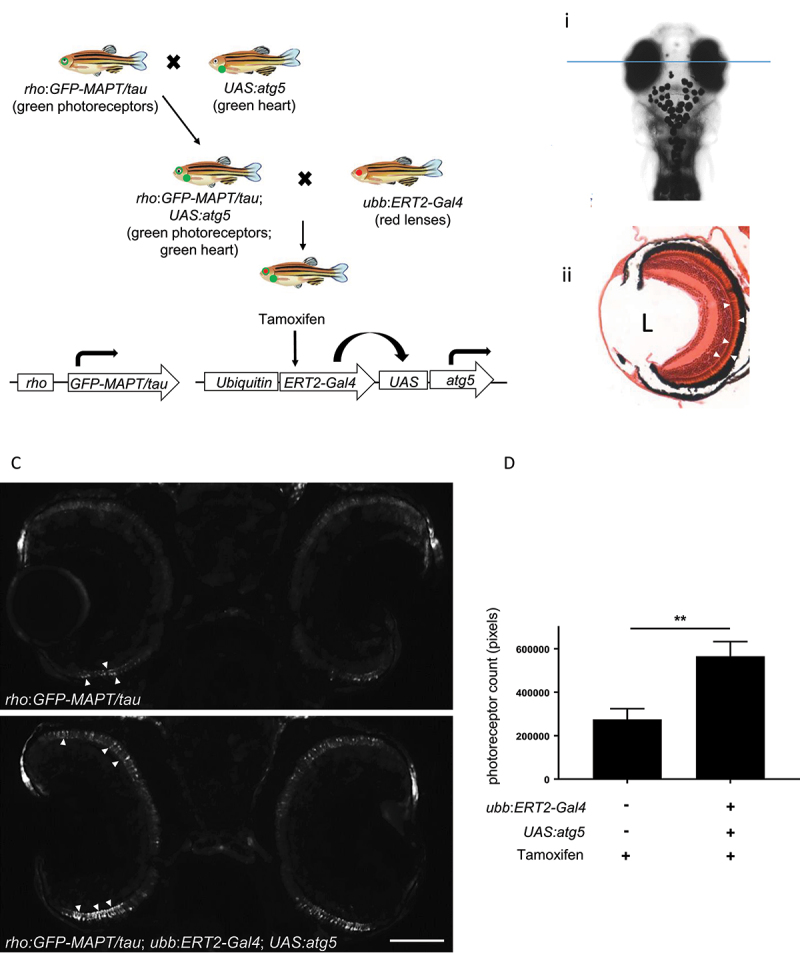
IMAGE

Figure 5.

ID
ZDB-IMAGE-230606-34
Source
Figures for Schlotawa et al., 2022
Image
Figure Caption

Figure 5.

Autophagy upregulation by induction of Atg5 expression ameliorates pathology in a zebrafish model of tauopathy. (a) Schematic diagram of crosses to generate triple transgenic zebrafish. Photoreceptor degeneration is observed in the zebrafish transgenic line expressing the GFP-tagged human MAPT gene under the control of the rhodopsin promoter (rho:GFP-MAPT/tau transgene). This degeneration has previously been shown to be ameliorated by pharmacological upregulation of autophagy [19]. The rho:GFP-MAPT/tau line was crossed to the UAS:atg5 transgenic line and double transgenic fish were identified as those with GFP expression in the retina and in the heart. These double transgenic fish were crossed with ubb:ERT2-Gal4 transgenic fish. From the final cross, 12.5% of offspring will inherit all 3 transgenes (GFP in retina and heart; RFP in the lens). All offspring were treated with 1 µM tamoxifen from 8 h.p.f. to 9 d.p.f. At the end of the treatment period, larvae were sorted for expression by GFP and RFP expression to identify those expressing only the rho:GFP-MAPT/tau transgene and those expressing all three transgenes. (b) Photoreceptor degeneration analysis. (I) Cryosections through the central retina (plane of section shown by blue line) were imaged and quantified to determine the photoreceptor number and distribution. (ii) Hematoxylin and eosin-stained histological section to demonstrate the photoreceptor layer (arrowheads). L marks position of lens. (c and d) By 9 d.p.f., almost all photoreceptors have degenerated in rho:GFP-MAPT/tau fish (upper panel) with just a few GFP-positive cells (arrowheads) remaining at the ciliary marginal zone. In triple transgenic zebrafish (overexpressing Atg5), there is a significant rescue of photoreceptor degeneration. Representative images taken using GFP filter (excitation 395–455 nm; emission 480 nm). Quantification of photoreceptors is shown in (d), (n ≥ 55 eyes analyzed per group; unpaired t-test, **p < 0.01). Scale bar: 50 µm.

Acknowledgments
This image is the copyrighted work of the attributed author or publisher, and ZFIN has permission only to display this image to its users. Additional permissions should be obtained from the applicable author or publisher of the image. Full text @ Autophagy