
|
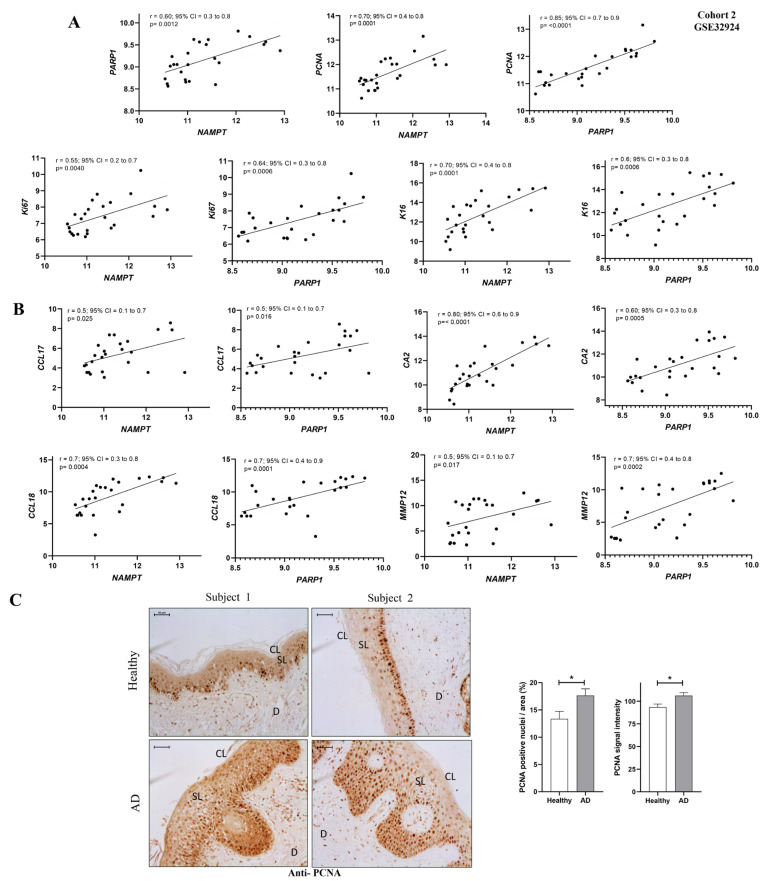
Figure 4
NAMPT and PARP1 levels correlated with lesional biomarkers of AD. (A) Correlation of NAMPT and PARP1 with proliferative markers. (B) Correlation of NAMPT and PARP1 with inflammatory markers. Univariate correlations were performed using transcriptomic data from GEO cohort 2 and calculated using Spearman’s correlation coefficient. (C) Representative images and analysis of biopsy sections from healthy (n = 10) and AD (n = 6) skin biopsies that have been immunostained with anti-PCNA. The mean ± SEM of each group is shown. p values were calculated using the nonparametric Mann–Whitney test, * p ≤ 0.05. Scale bar is 50 μm in all panels. CL: cornified layer; D: dermis; SL: spinous layer.