
|
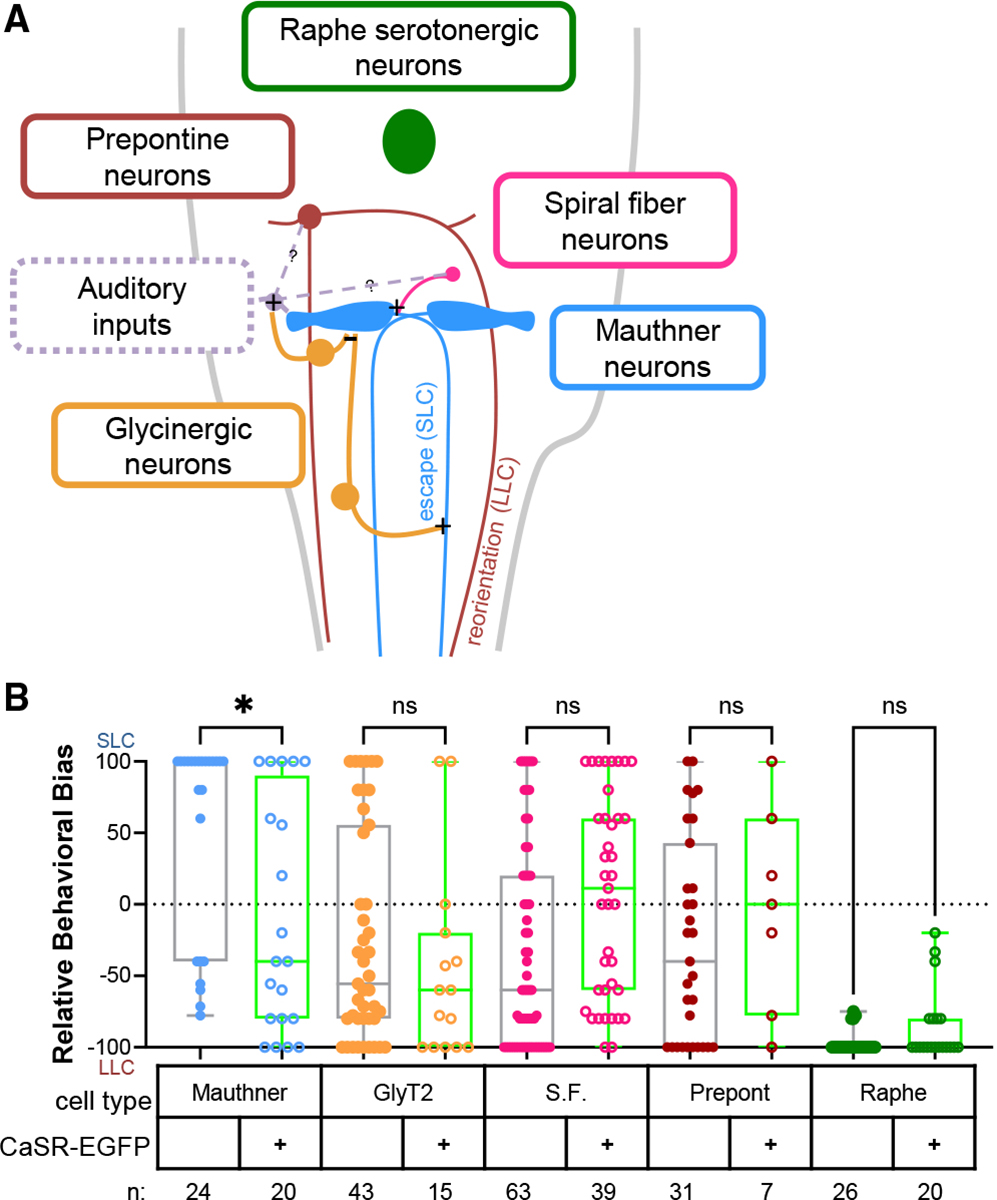
Fig. 3
(A) Diagram of circuit relationships of SLC and LLC circuit components. Blue, Mauthner; orange, glycincergic neurons including feedforward and feedback inhibitory neurons; pink, spiral fiber feedforward excitatory neurons; brick red, prepontine LLC-mediating neurons; green, serotonergic neurons of the Raphe.
(B) Relative behavioral bias of CaSR mutant larvae either not expressing (filled circle, gray box and whiskers) or expressing (empty circle, green box and whiskers) UAS:CaSR-EGFP in the indicated cell type. Colors as in (A). CaSR-EGFP negative control larvae versus Mauthner CaSR-EGFP larvae p = 0.0294; note that these larvae were shifted toward reorientations, the opposite direction expected from behavioral rescue. n.s. indicates p > 0.05. Lines indicate median, box extends from 25th to 75th percentile. p values are from Kruskal-Wallis test with Dunn’s multiple comparisons post hoc test.