
Image
|
Figure Caption
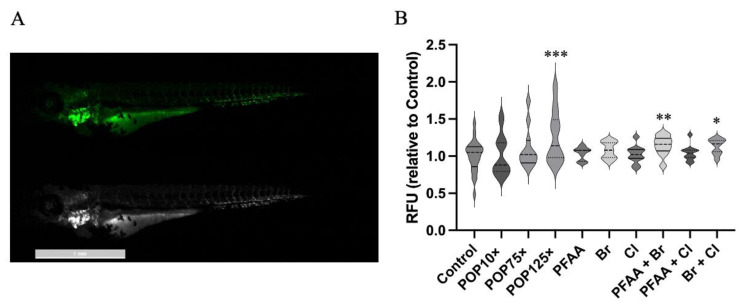
Figure 8
(A) Transgenic Tg(kdrl-mls:GFP) fish line treated with POP125×. (B) Plot with median values of the normalized fluorescence intensity of fish treated with different POP mixes at 96 hpf. There is a clear increasing trend. Kruskal–Wallis test and Dunn’s multiple comparison, n = 21, p < 0.05 (*), p < 0.01 (**), p < 0.001 (***).
Acknowledgments
This image is the copyrighted work of the attributed author or publisher, and
ZFIN has permission only to display this image to its users.
Additional permissions should be obtained from the applicable author or publisher of the image.
Full text @ Toxics