
|
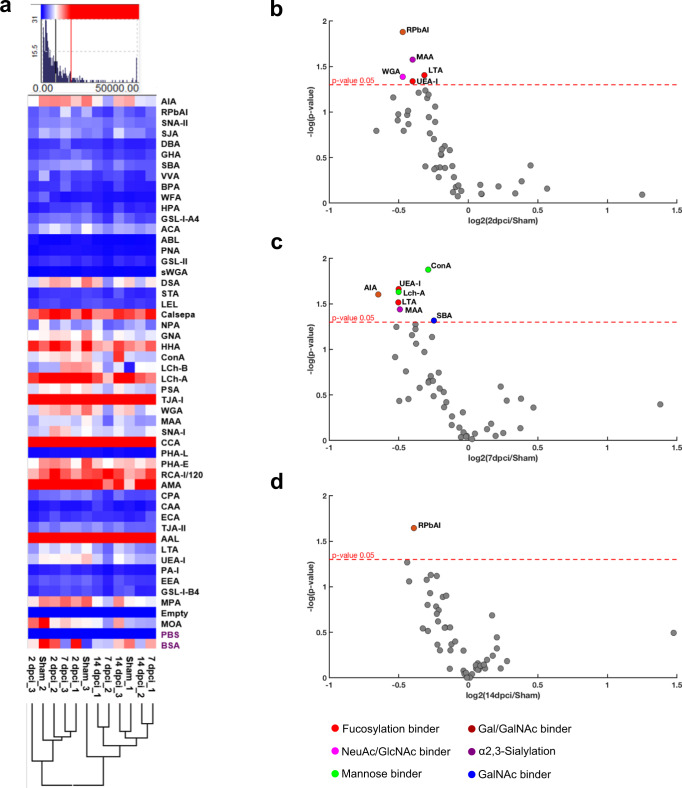
Fig. 3
a Hierarchical clustering of lectin microarray data. Asialofetuin (ASF) was used as control glycoprotein and all lectin binding intensities were normalized. b Lectin microarray dot plot of 2 dpci, c 7 dpci and d 14 dpci in respect to the sham showing a reduction of: sialylation (MAA, WGA), fucosylation (LTA, UEA-I), GlcNAc (WGA) and Gal/GalNAc (RPbAI) at 2 dpci; sialylation (MAA), fucosylation (LTA, UEA-I), mannose (Con A, Lch-A), Gal/GalNAc (AIA) and GalNAc (SBA) at 7 dpci; and Gal/GalNAc (RPbAI) at 14 dpci. One-way ANOVA analysis with Tukey’s post hoc correction was applied. Spot colors correspond to lectin sugar specificity; the red dotted line represents a significant cutoff of p value ≤ 0.05. Three biological replicates were analyzed, each one deriving from the pooling of 4 different animals (n = 12).