
|
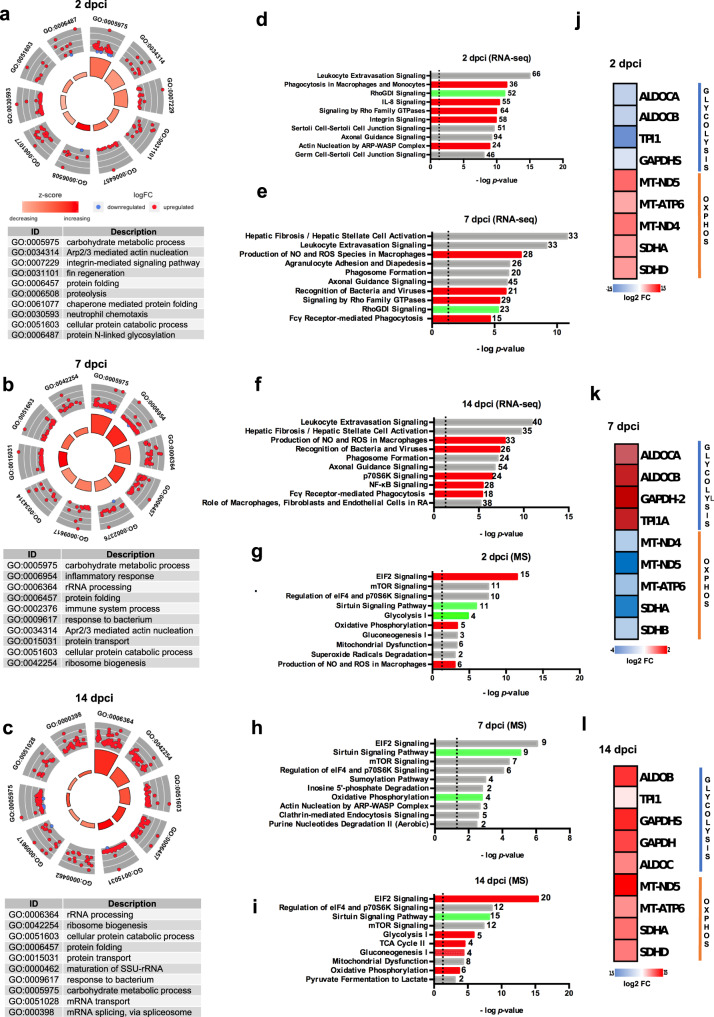
Fig. 1
a GOCircle plot summarizing gene ontology enrichment analysis at 2 dpci, b 7 dpci and c 14 dpci; “carbohydrate metabolic process” and “N-linked glycosylation” are identified as significantly activated processes, among others. The significance of each term (-log10 adjusted p value) is specified by the height of the bar plot in the inner ring, while the color corresponds to the z-score. The expression level (log2FC) for the genes in each term is displayed in the outer ring scatterplots; red dots indicated upregulated genes and blue dots downregulated genes. d The most statistically significant canonical pathways for the transcriptomic analysis at 2 dpci, e 7 dpci and f 14 dpci identified using the IPA® software are listed according to their p value (-log); the threshold -log(p value) = 1.3 corresponds to a p value of 0.05. Activation is indicated in red, inhibition in green and unpredictability in gray. g The most statistically significant canonical pathways for the proteomic analysis at 2 dpci, h 7 dpci and i 14 dpci. j Heatmap showing glycolytic enzymes and mitochondrial oxidative phosphorylation proteins at 2 dpci, k 7 dpci and l 14 dpci. Two biological replicates deriving from the pooling of 4 different animals (n = 8 animals per group) were analyzed for all experiments. For proteomic analysis n = 4 animals per group were used.