
Image
|
Figure Caption
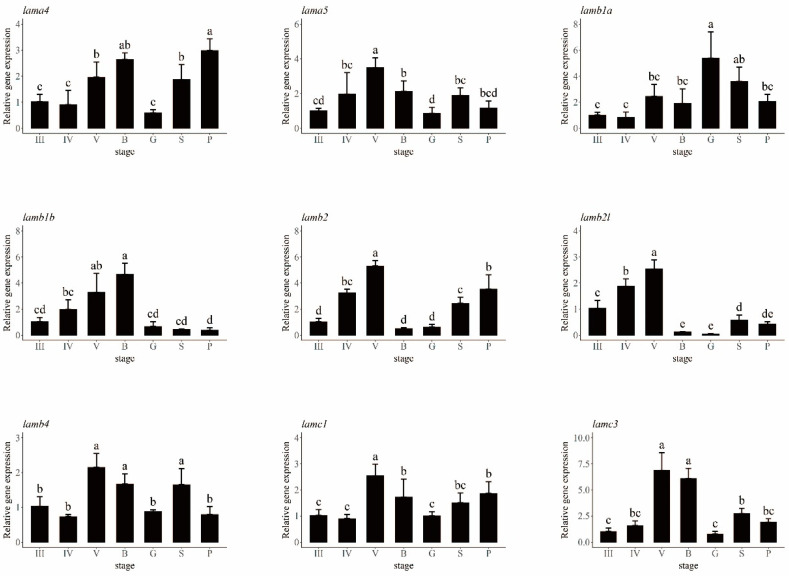
Fig. 6
Expression analysis of laminin genes at seven different ovarian development stages. The relative expression levels of laminin genes are shown in different colors. III: ovary at stage III; IV: ovary at stage IV; V: ovary at stage V; B: blastula stage; G: gastrula stage; S: somites stage; P: prehatching stage. Different letters are signs of significant differences.
Acknowledgments
This image is the copyrighted work of the attributed author or publisher, and
ZFIN has permission only to display this image to its users.
Additional permissions should be obtained from the applicable author or publisher of the image.
Full text @ Int. J. Mol. Sci.