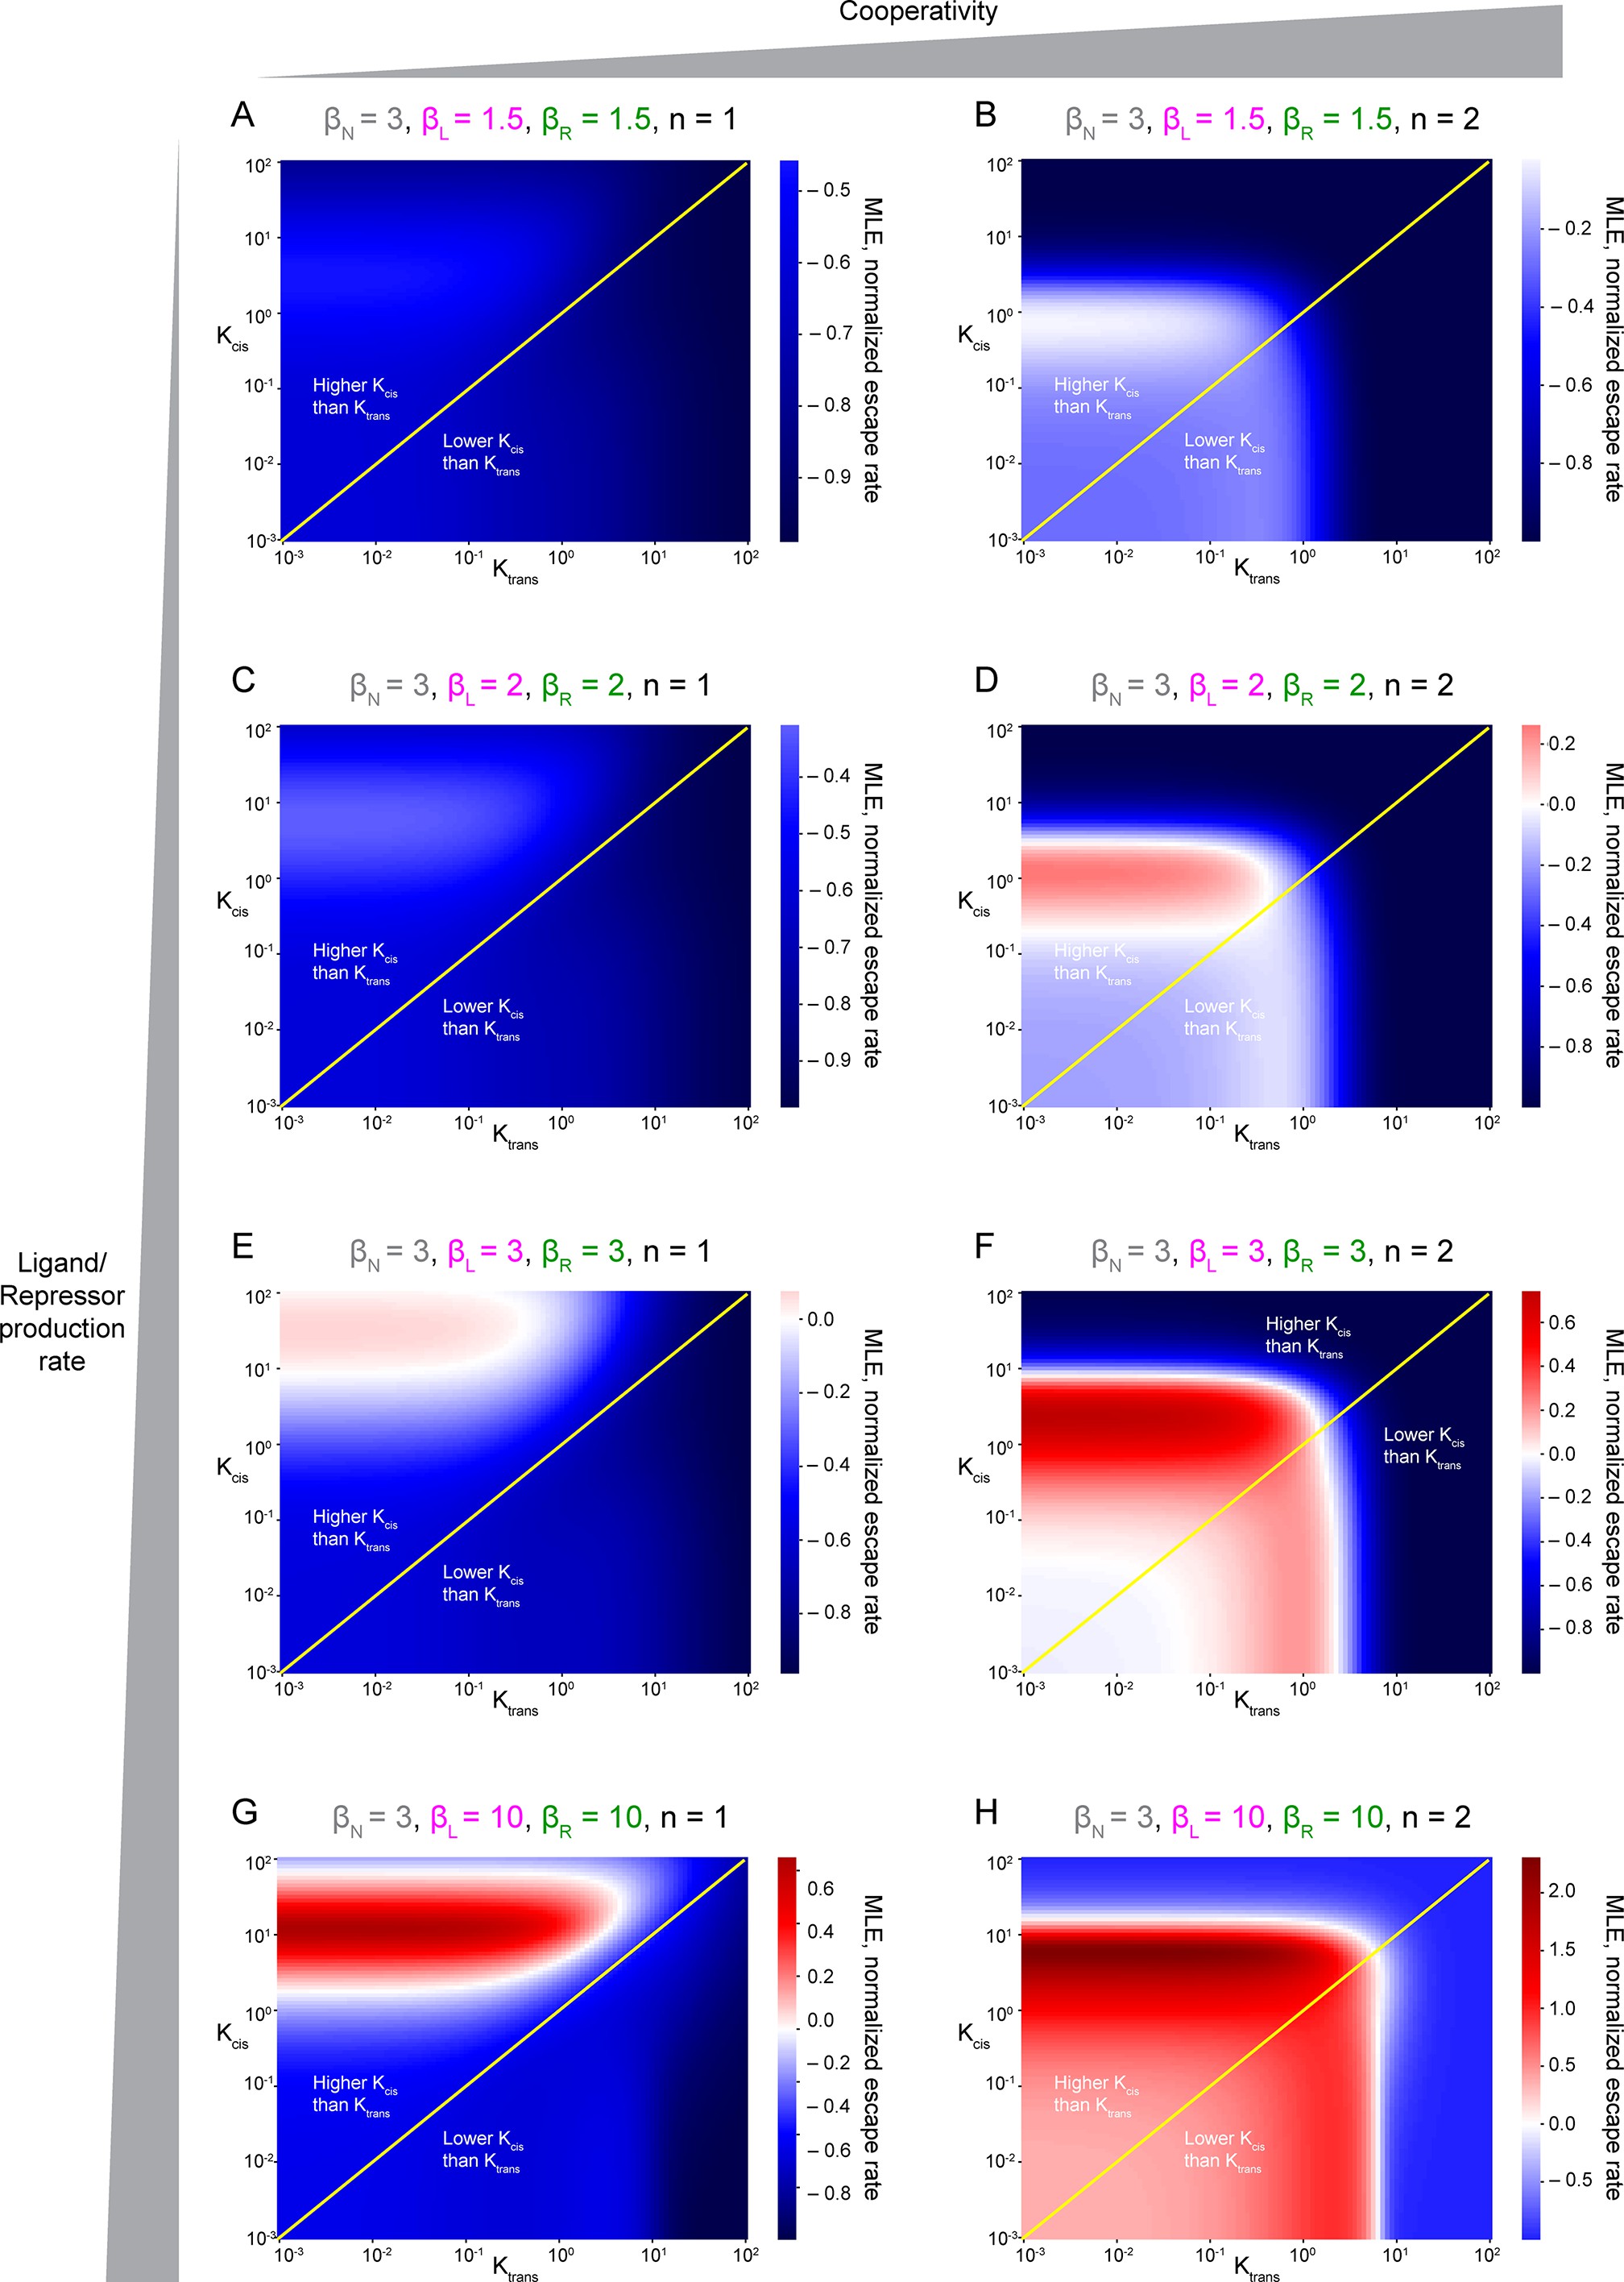
Fig. 6; supplement 2
They are represented by Maximum Lyapunov Exponents, or MLE, as a function of Kcis and Ktrans parameters. Positive MLE values (red) support patterning, while negative MLE values (blue) do not. (A, C, E, G) Non-cooperativity. (B, D, E, H) Cooperativity. βN, production rate of Notch receptor; βL, production rate of Ligand, βR, production rate of receptor. Panel H has been duplicated from Figure 5J for easier comparison with the rest of plots.
Escape rates from the homogeneous steady state.
Image
Figure Caption
Acknowledgments
This image is the copyrighted work of the attributed author or publisher, and
ZFIN has permission only to display this image to its users.
Additional permissions should be obtained from the applicable author or publisher of the image.
Full text @ Elife

