
Image
|
Figure Caption
Figure 6
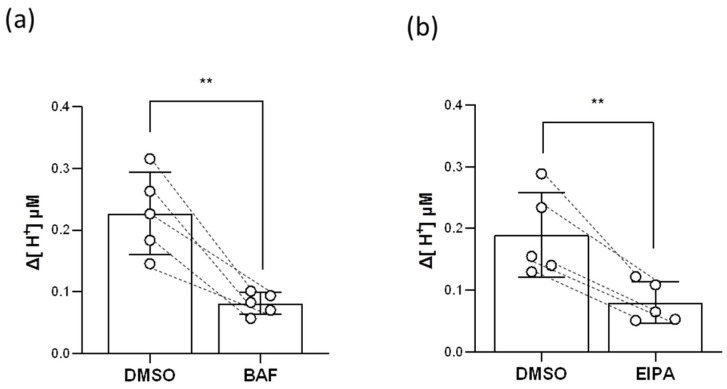
Figure 6. Effects of BAF and EIPA on the branchial H+-excreting capacity. H+ gradients at the gills were analyzed before and after BAF (a) or EIPA (b) treatments by the SIET. The dashed line represents the same fish. Values are the mean ± SD (N = 5). Student’s t-test, ** p < 0.01. BAF = bafilomycin A1. EIPA = 5-ethylisopropyl amiloride.
Acknowledgments
This image is the copyrighted work of the attributed author or publisher, and
ZFIN has permission only to display this image to its users.
Additional permissions should be obtained from the applicable author or publisher of the image.
Full text @ Int. J. Mol. Sci.