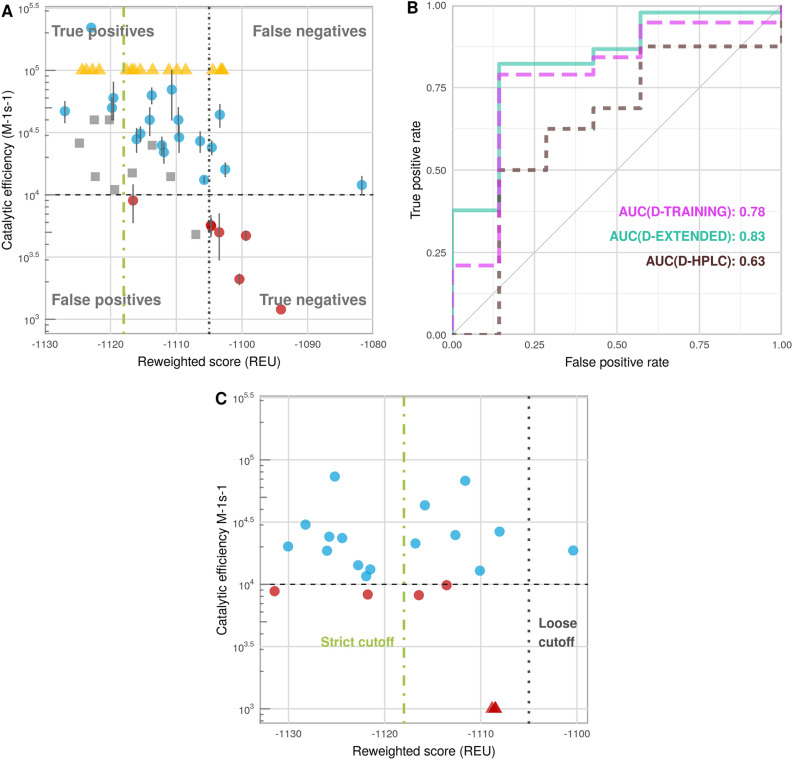
Performance of the calibrated protocol on different datasets (see Supplementary Table S2). (A) Correlation: Predicted vs. measured activities on D-TRAINING (dots, blue: substrates, red: non-substrates); D-CAPPED (yellow triangles); and D-TEST (grey squares) datasets. (B) Binary distinction: ROC curves on D-TRAINING (magenta), D-EXTENDED (cyan) and D-HPLC (brown). (C) Performance of protocol on D-HPLC, a dataset measured using HPLC (from Kutil et al.3). In (A) and (C), a dashed horizontal line denotes the cutoff dividing measured substrates and non-substrates (kcat/KM=104 M−1 s−1). Note the different scales in (A) and (C). The cutoffs dividing predicted substrates from not substrates are indicated as dotted vertical line for the loose cutoff (reweighted score: − 1105) and a dotted-dashed vertical line for the strict cutoff (reweighted score: − 1118).
Acknowledgments
This image is the copyrighted work of the attributed author or publisher, and
ZFIN has permission only to display this image to its users.
Additional permissions should be obtained from the applicable author or publisher of the image.
Full text @ Sci. Rep.
Your Input Welcome
Thank you for submitting comments. Your input has been emailed to ZFIN curators who may contact you if
additional information is required.
Oops. Something went wrong. Please try again later.