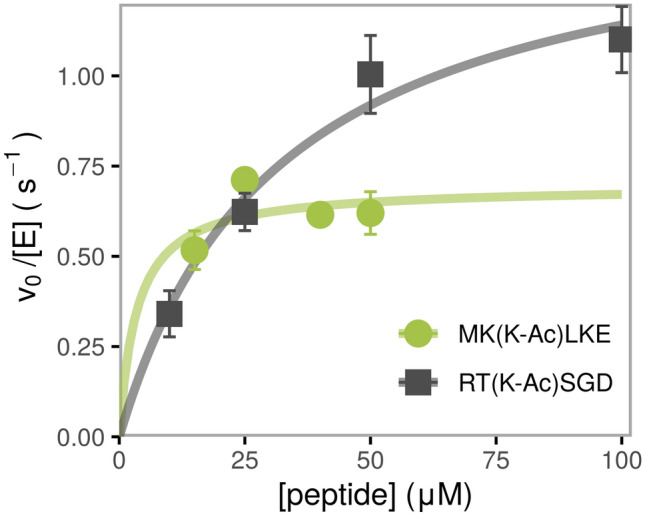
IMAGE

Figure 1

ID
ZDB-IMAGE-220310-1
Source
Figures for Varga et al., 2022
Image
Figure Caption

Figure 1

Dependence of deacetylation rate on substrate concentration for two representative peptides catalyzed by HDAC6, measured using the acetate assay. The initial velocity for each substrate concentration was determined from a linear regression of a time course consisting of a minimum of three timepoints, standard error is shown. The kinetic parameters are determined from a nonlinear least square fit of the Michaelis–Menten equation to the data and are listed in Table 1. Black squares: example of data which met the criteria to produce accurate kcat/KM values. Green circles: example of overfit data resulting in calculation of a lower limit for kcat/KM, due to the KM being lower than the detection limit of the assay.

Acknowledgments
This image is the copyrighted work of the attributed author or publisher, and ZFIN has permission only to display this image to its users. Additional permissions should be obtained from the applicable author or publisher of the image. Full text @ Sci. Rep.