
|
Figure 3
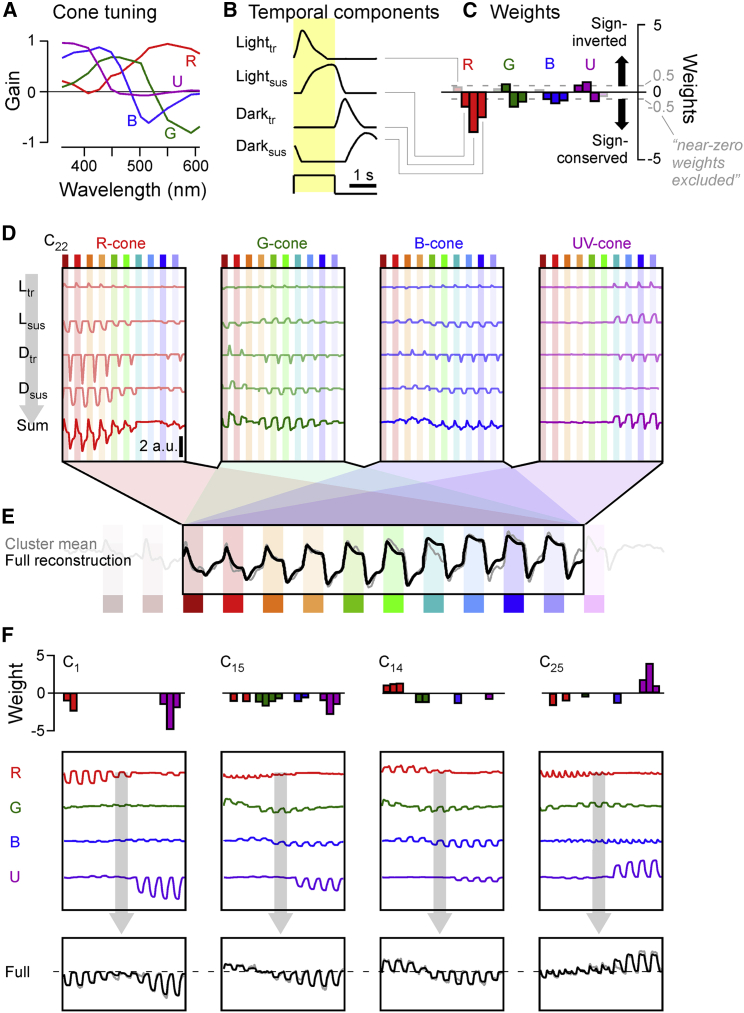
Reconstructing bipolar cell responses from cones
(A–E) Summary of the reconstruction strategy for example cluster C22 (for details, see
(F) As (A)–(E) but showing only the weights (top), cone totals (middle), and full reconstructions (bottom) for another four example clusters (from left: C1; C15; C14; and C25).
Further detail on reconstructions is shown in