
|
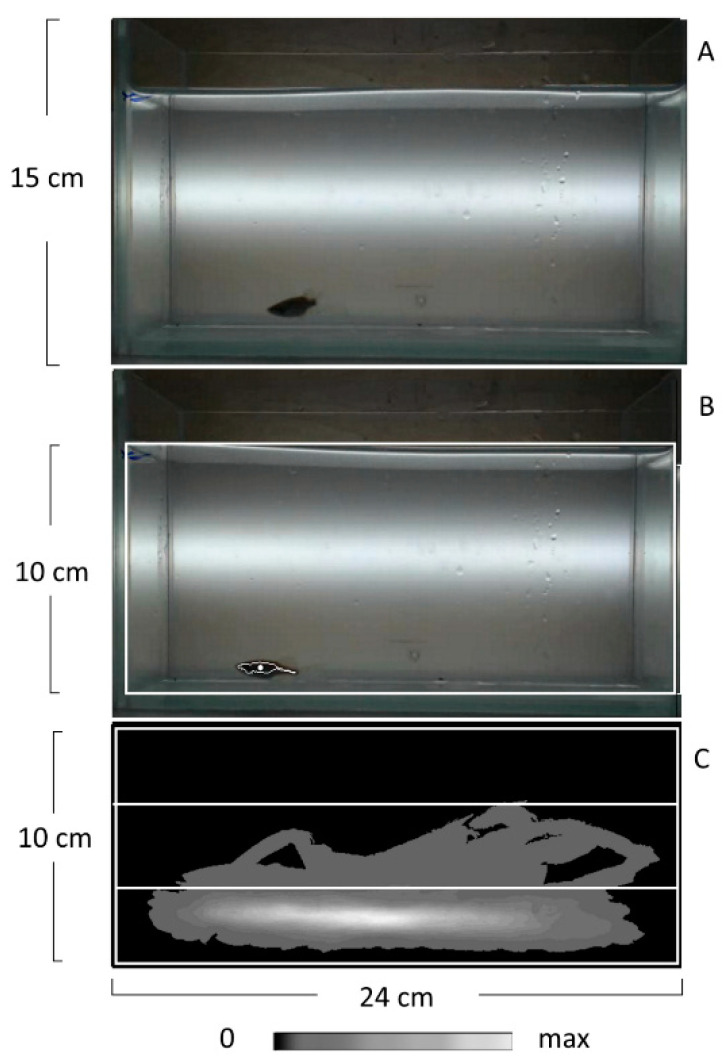
Figure 7 Tracking zebrafish in the novel tank diving test by EthoStudio software. (A) Photo of the tank for testing (24 cm in length, 15 cm in depth, and 7 cm in width) filled with water and with a zebrafish inside. (B) The white rectangle marks the water surface selected as the tracking arena, which is 24 cm in length and 10 cm in depth. EthoStudio software finds the contour and the center of a zebrafish and marks them with a white line and a point, respectively. (C) EthoStudio software calculates the density map of pixel distribution associated with zebrafish on the arena. Pixel density is coded gray according to the scale placed below the map. The arena is divided into three equal thirds. The map shows that most of the pixels associated with a zebrafish are in the lower third.