
|
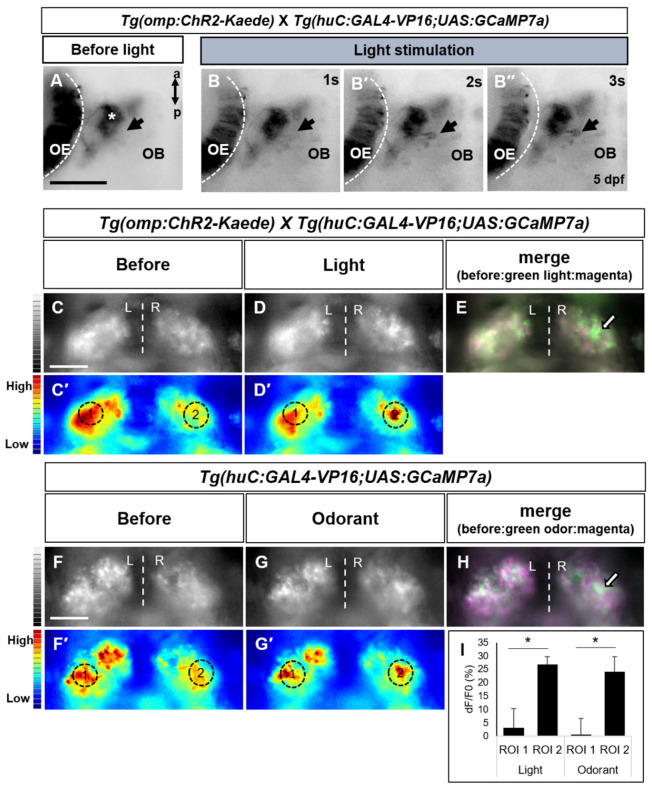
Figure 3 Analysis of calcium transient in olfactory bulb and habenula evoked light/odor stimuli. (A) Olfactory epithelium (OE) and olfactory bulb (OB) of transgenic fish before light irradiation. (B,B′,B″) After light stimulation, calcium signals were detected in olfactory bulb. Asterisk indicates axon terminals of olfactory sensory neurons and arrow indicates newly emerging cell bodies by optical stimulation. a, anterior; p posterior. Scale bar: 50 μm. (C–H) Odor responses of habenula in transgenic zebrafish lines. (C–D′) In Tg(omp:ChR2-Kaede);Tg(huc:GAL4-VP16;uas:GCaMP7a), habenular neuron responses to light. (F–G′) Odorant evoked habenular response in Tg(huc:GAL4-VP16;uas:GCaMP7a). Cells before stimulated were colored in magenta, and cells responding to light/odor were colored in green (E,H). Data are representative of at least two independent experiments. (I) Bar chart showing average dF/F0 of ROI 1 (left habenula) or ROI 2 (right habenula) in zebrafish brain expressing GCaMP7a upon the ChR2 driven light or odor activation (n = 3 each group). Dotted circles depict ROI of quantitative analysis. All values represent mean ± S.E.M. * p < 0.05. p value was determined by Student’s t test. L, left; R, right; ROI, region of interest. Scale bars: 50 μm.