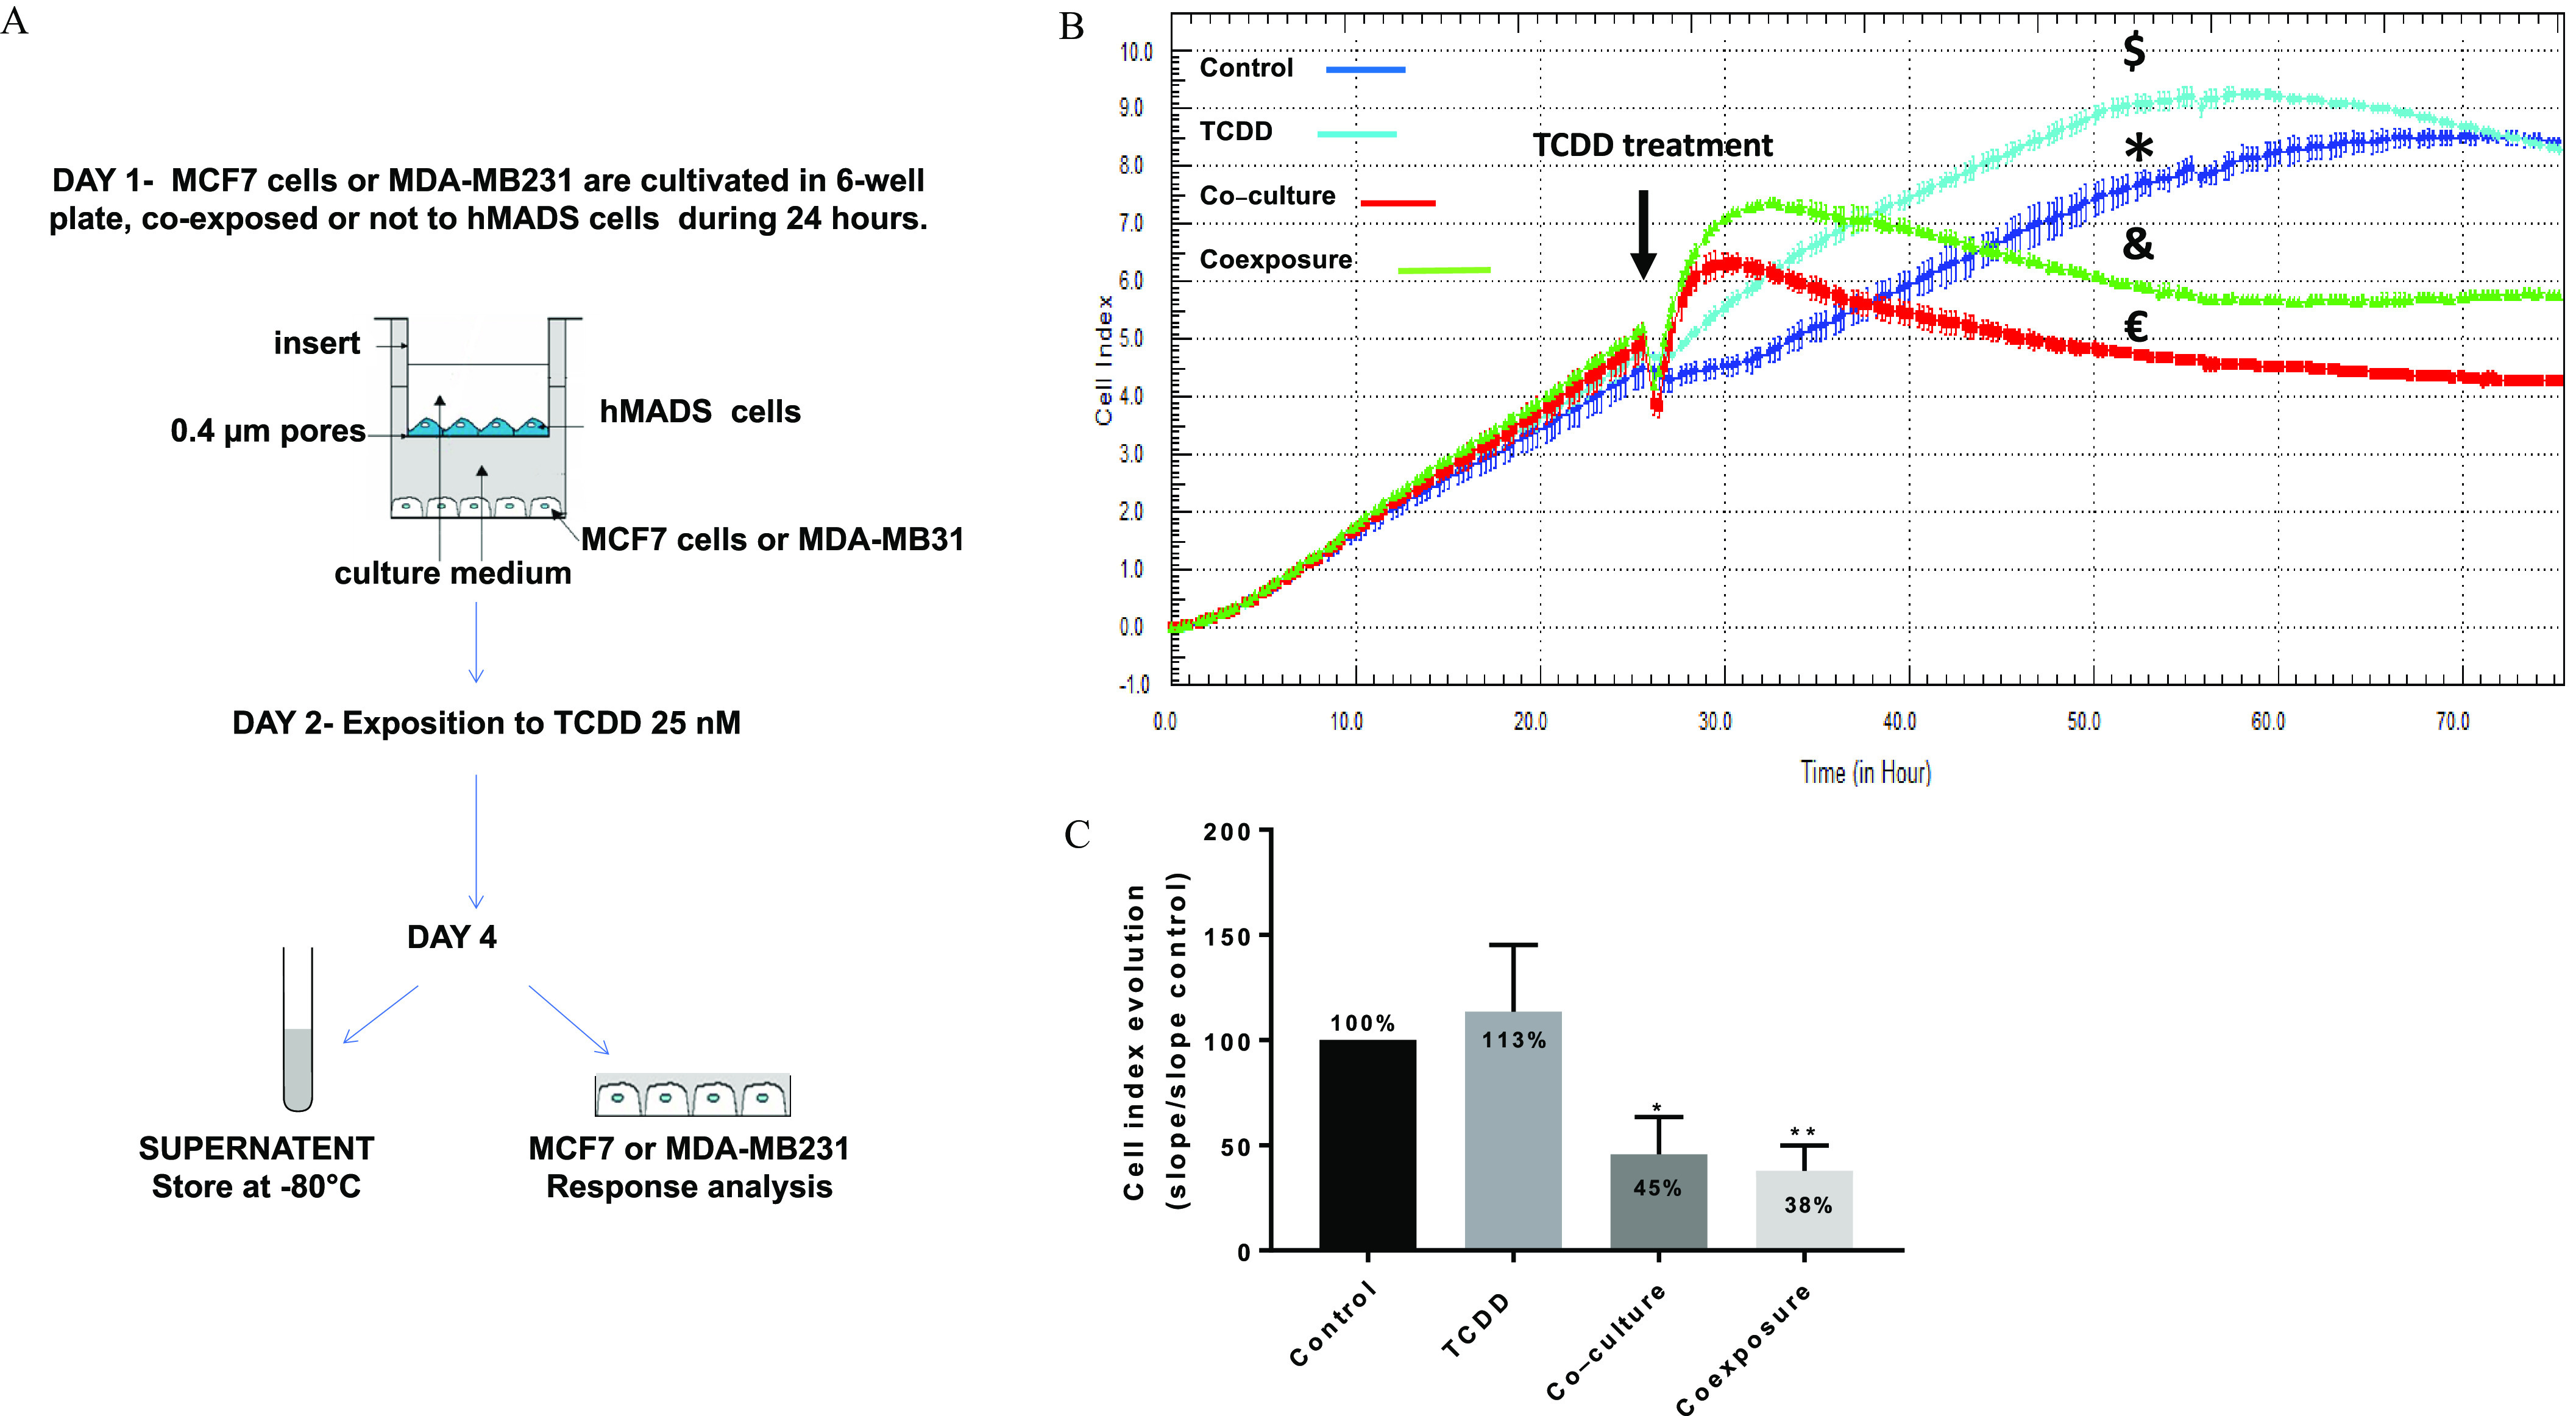
Figure 1.
Co-culture model and real time MCF7 cells analysis. (A) Presentation of the 2D co-culture system and the protocol. (B) xCELLigence dynamic monitoring of MCF-7 cells, A representative graph from xCELLigence system: cell index (CI) profiles are the

