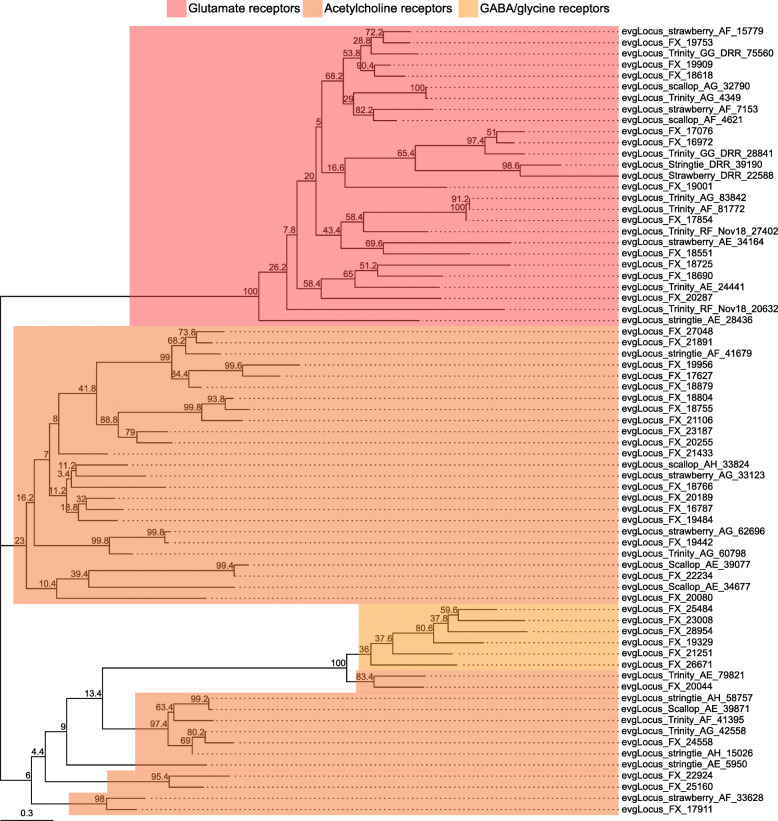
IMAGE

Fig. 8

ID
ZDB-IMAGE-210113-110
Source
Figures for Dong et al., 2021
Image
Figure Caption

Fig. 8

Ionotropic neurotransmitter receptor families identified in the L. stagnalis CNS transcriptome assembly. The tree with the highest log likelihood (− 7343.03) is shown. The percentage of trees in which the associated taxa clustered together (bootstrap values) is shown next to the branches. The tree is rooted at the mid-point and is drawn to scale, with branch lengths measured in the number of substitutions per site (see scale in bottom left). This analysis involved 33 amino acid sequences. There were a total of 133 positions in the final dataset. Evolutionary analyses were conducted in MEGA X (ver. 10.1.8) and tree visualization and annotation was conducted using the ggtree package (ver. 2.0.4) for R (ver. 3.6.3). This L. stagnalis transcriptome assembly identifies a wide diversity of putative acetylcholine, GABA/glycine, and glutamate receptors. The accession numbers and BLAST information of transcripts represented in this tree are provided in Tables S20, S21 and S22

Acknowledgments
This image is the copyrighted work of the attributed author or publisher, and ZFIN has permission only to display this image to its users. Additional permissions should be obtained from the applicable author or publisher of the image. Full text @ BMC Genomics