IMAGE

Figure 6

ID
ZDB-IMAGE-200406-88
Source
Figures for Okano et al., 2020
Image
Figure Caption

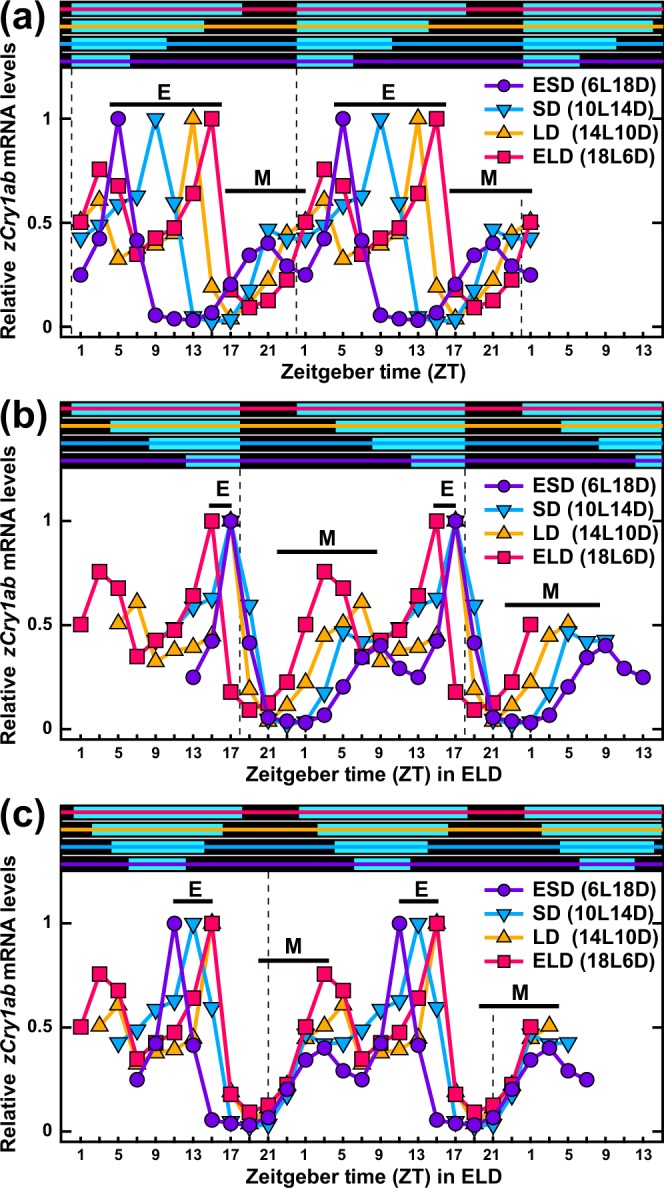
Figure 6

Double plots of 24-h profiles of relative zCry1ab expression levels in the eye under different photoperiods. Relative values of zCry1ab expression levels (Fig. 5; normalized by the peak) were double-plotted using ‘lights on’ (panel a), ‘lights off’ (panel b) or the middle of the night (panel c) as reference points. Data for two points at ZT1 (the start and end of sampling) were averaged. Evening peaks and increasing phases to morning (shoulder) peaks are indicated by E and M, respectively. Light conditions are indicated by bars with colored lines at the top of each panel.

Acknowledgments
This image is the copyrighted work of the attributed author or publisher, and ZFIN has permission only to display this image to its users. Additional permissions should be obtained from the applicable author or publisher of the image. Full text @ Sci. Rep.