IMAGE

FIGURE 14

ID
ZDB-IMAGE-191230-78
Source
Figures for König et al., 2019
Image
Figure Caption

FIGURE 14

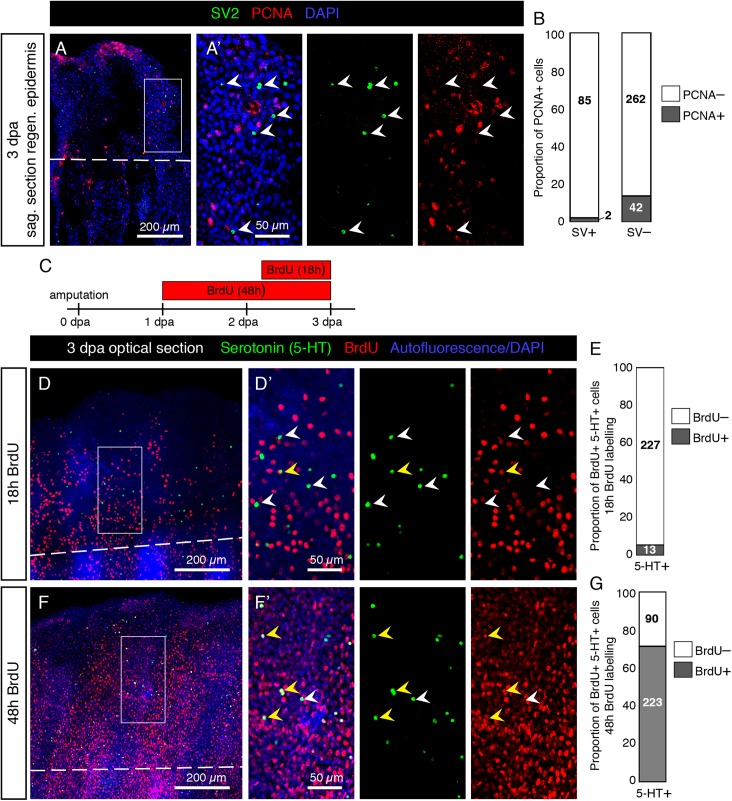
Low proliferative rate of mature HCS-cells during fin regeneration. (A) Immunofluorescent staining for SV2 (green) and PCNA (red) on sagittal section of fin wound epidermis at 3 dpa. (A’) SV2-positive cells are PCNA-negative (arrowheads). (B) Proportion of PCNA-positive cells among SV2-positive HCS-cells versus in SV2-negative epidermal cells (2.3% PCNA-positive in HCS-cells versus 13.8% PCNA-positive in other cells). N = 3. Number of cells for each group indicated on graph. (C) Experimental design for BrdU assays. (D,F) Immunofluorescence staining of whole mount fins at 3 dpa for serotonin (green) and BrdU (red) after 18 h or 48 h of BrdU-treatment. The image shows confocal imaging through the epidermis distal to the amputation plane (dashed line). (D’,F’) Zoomed areas show BrdU-negative (white arrowhead) and BrdU-positive (yellow arrowhead) 5-HT-positive cells. (E,G) Proportion of BrdU-positive cells among 5-HT-positive cells after 18 and 48 h of labeling (5.4 and 71%, respectively). N = 3 fins; total number of cells in each group indicated on graph.

Acknowledgments
This image is the copyrighted work of the attributed author or publisher, and ZFIN has permission only to display this image to its users. Additional permissions should be obtained from the applicable author or publisher of the image. Full text @ Front. Mol. Neurosci.