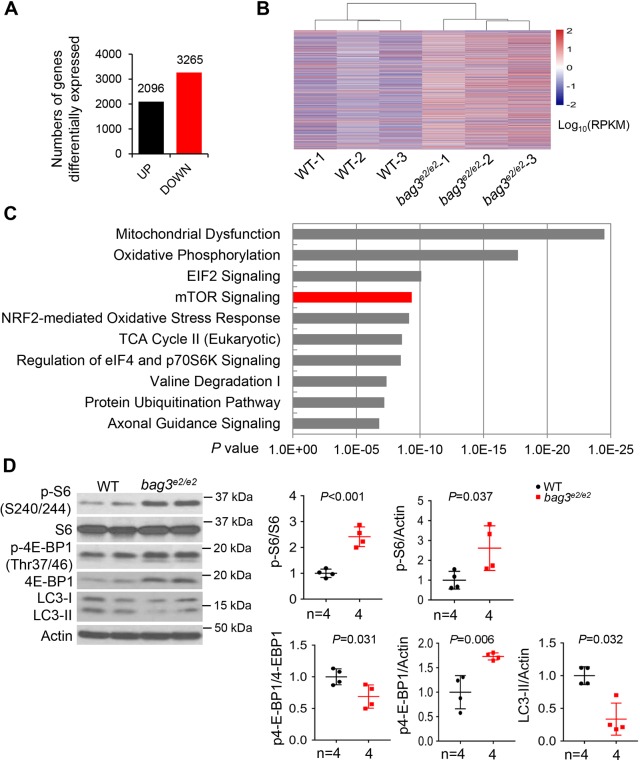
Transcriptome analysis identifies mTOR as one of the top signaling pathways affected in the bag3e2/e2 mutant. (A) Numbers of differentially expressed (DE) genes between bag3e2/e2 mutant hearts and WT control with a cutoff of adjusted P<0.05. (B) Heat map presenting the expression of 5361 DE genes between the bag3e2/e2 mutant and WT control. Gene expression levels are shown in log10 [reads per kilobase per million reads (RPKM)]. (C) The top 10 DE gene enriched pathways with significant P-values suggested by IPA. The red column shows that the mTOR pathway was one of the top pathways altered and was subsequently experimentally tested. (D) Representative western blot images and quantification analysis of the expression levels of mTOR downstream proteins. LC3-II protein was examined in heart tissues from fish treated with 50 nM bafilomycin A1 for 4 h. n=4 biological replicates, Student's t-test. Data are mean±s.e.m.
This image is the copyrighted work of the attributed author or publisher, and
ZFIN has permission only to display this image to its users.
Additional permissions should be obtained from the applicable author or publisher of the image.
Full text @ Dis. Model. Mech.
Your Input Welcome
Thank you for submitting comments. Your input has been emailed to ZFIN curators who may contact you if
additional information is required.
Oops. Something went wrong. Please try again later.