
|
Fig. 4
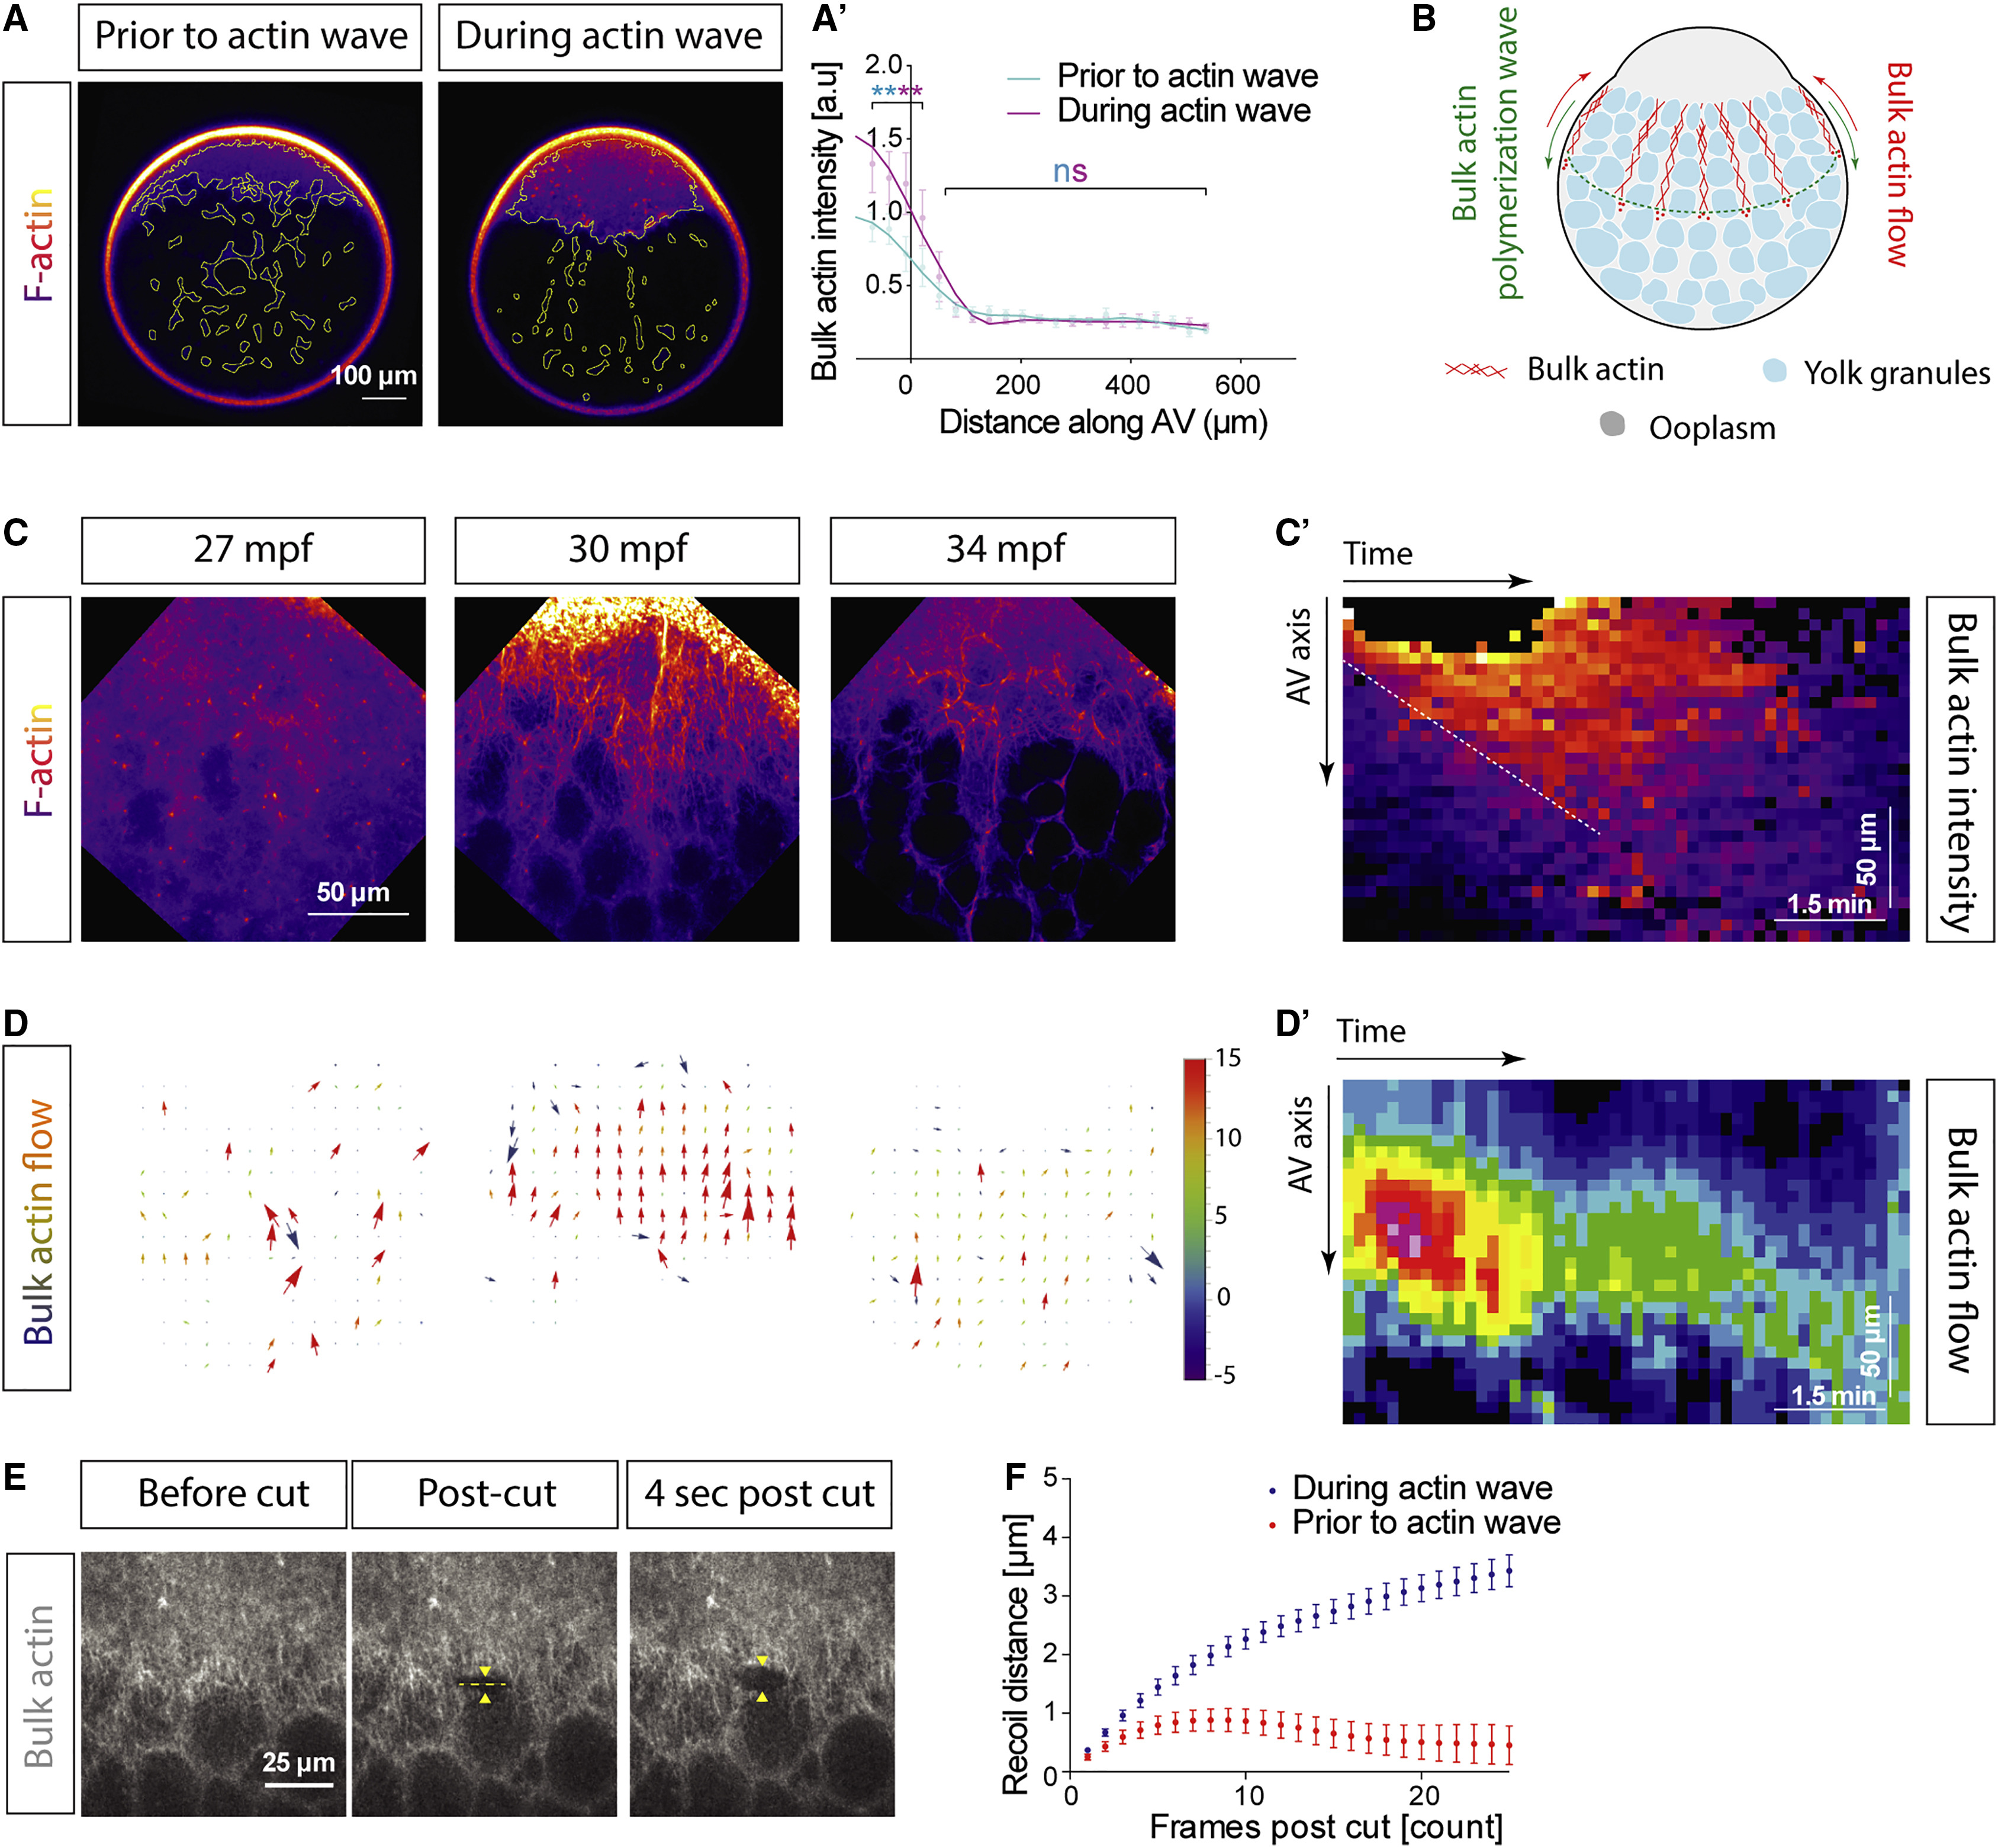
Contractility-Driven Actin Network Flows during Ooplasm-Yolk Granules Segregation
(A) Images of oocytes expressing Utr-GFP to mark F-actin. The yellow ROIs indicate ooplasmic pockets across the oocyte, where actin intensity was measured in (A′).
(A′) Normalized intensity of the bulk actin within the ooplasm along the oocyte animal-vegetal (AV) axis prior to (cyan) and during (magenta) bulk actin polymerization wave. N = 4 experiments, n = 7 oocytes. ∗∗∗∗p < 0.001, ns, not significant, Mann-Whitney test.
(B) Schematic illustrating the vegetalward movement of the bulk actin polymerization wave (green) and animalward flows of bulk actin (red) along the actin gradient shown in (A′).
(C) High magnification images of marginal regions of the oocyte marking F-actin.
(C′) Kymograph of actin intensity observed in (C) along the AV axis as a function of time. White dashed line outlines the boundary of the bulk actin polymerization wave. Hot-to-cold color coding corresponds to high-to-low actin intensity.
(D) PIV analysis of F-actin flows in the regions of the oocyte shown in (C). Color code ranges from high (red) to low absolute velocities (blue); in μm/min.
(D′) Kymograph of actin velocities along the AV axis of the oocyte as a function of time. Velocity is color coded as in (D).
(E) Images of oocytes marking F-actin during bulk actin network laser ablation. Yellow dashed line, laser ablation site. Arrowheads outline recoil of the actin network around the cut.
(F) Recoil distance of the cut actin network prior (red, N = 3, n = 15) and during (blue, N = 5, n = 13) bulk actin polymerization wave, calculated from kymographs as shown in Figures S5D and S5E.
Reprinted from Cell, 177(6), Shamipour, S., Kardos, R., Xue, S.L., Hof, B., Hannezo, E., Heisenberg, C.P., Bulk Actin Dynamics Drive Phase Segregation in Zebrafish Oocytes, 1463-1479.e18, Copyright (2019) with permission from Elsevier. Full text @ Cell