
|
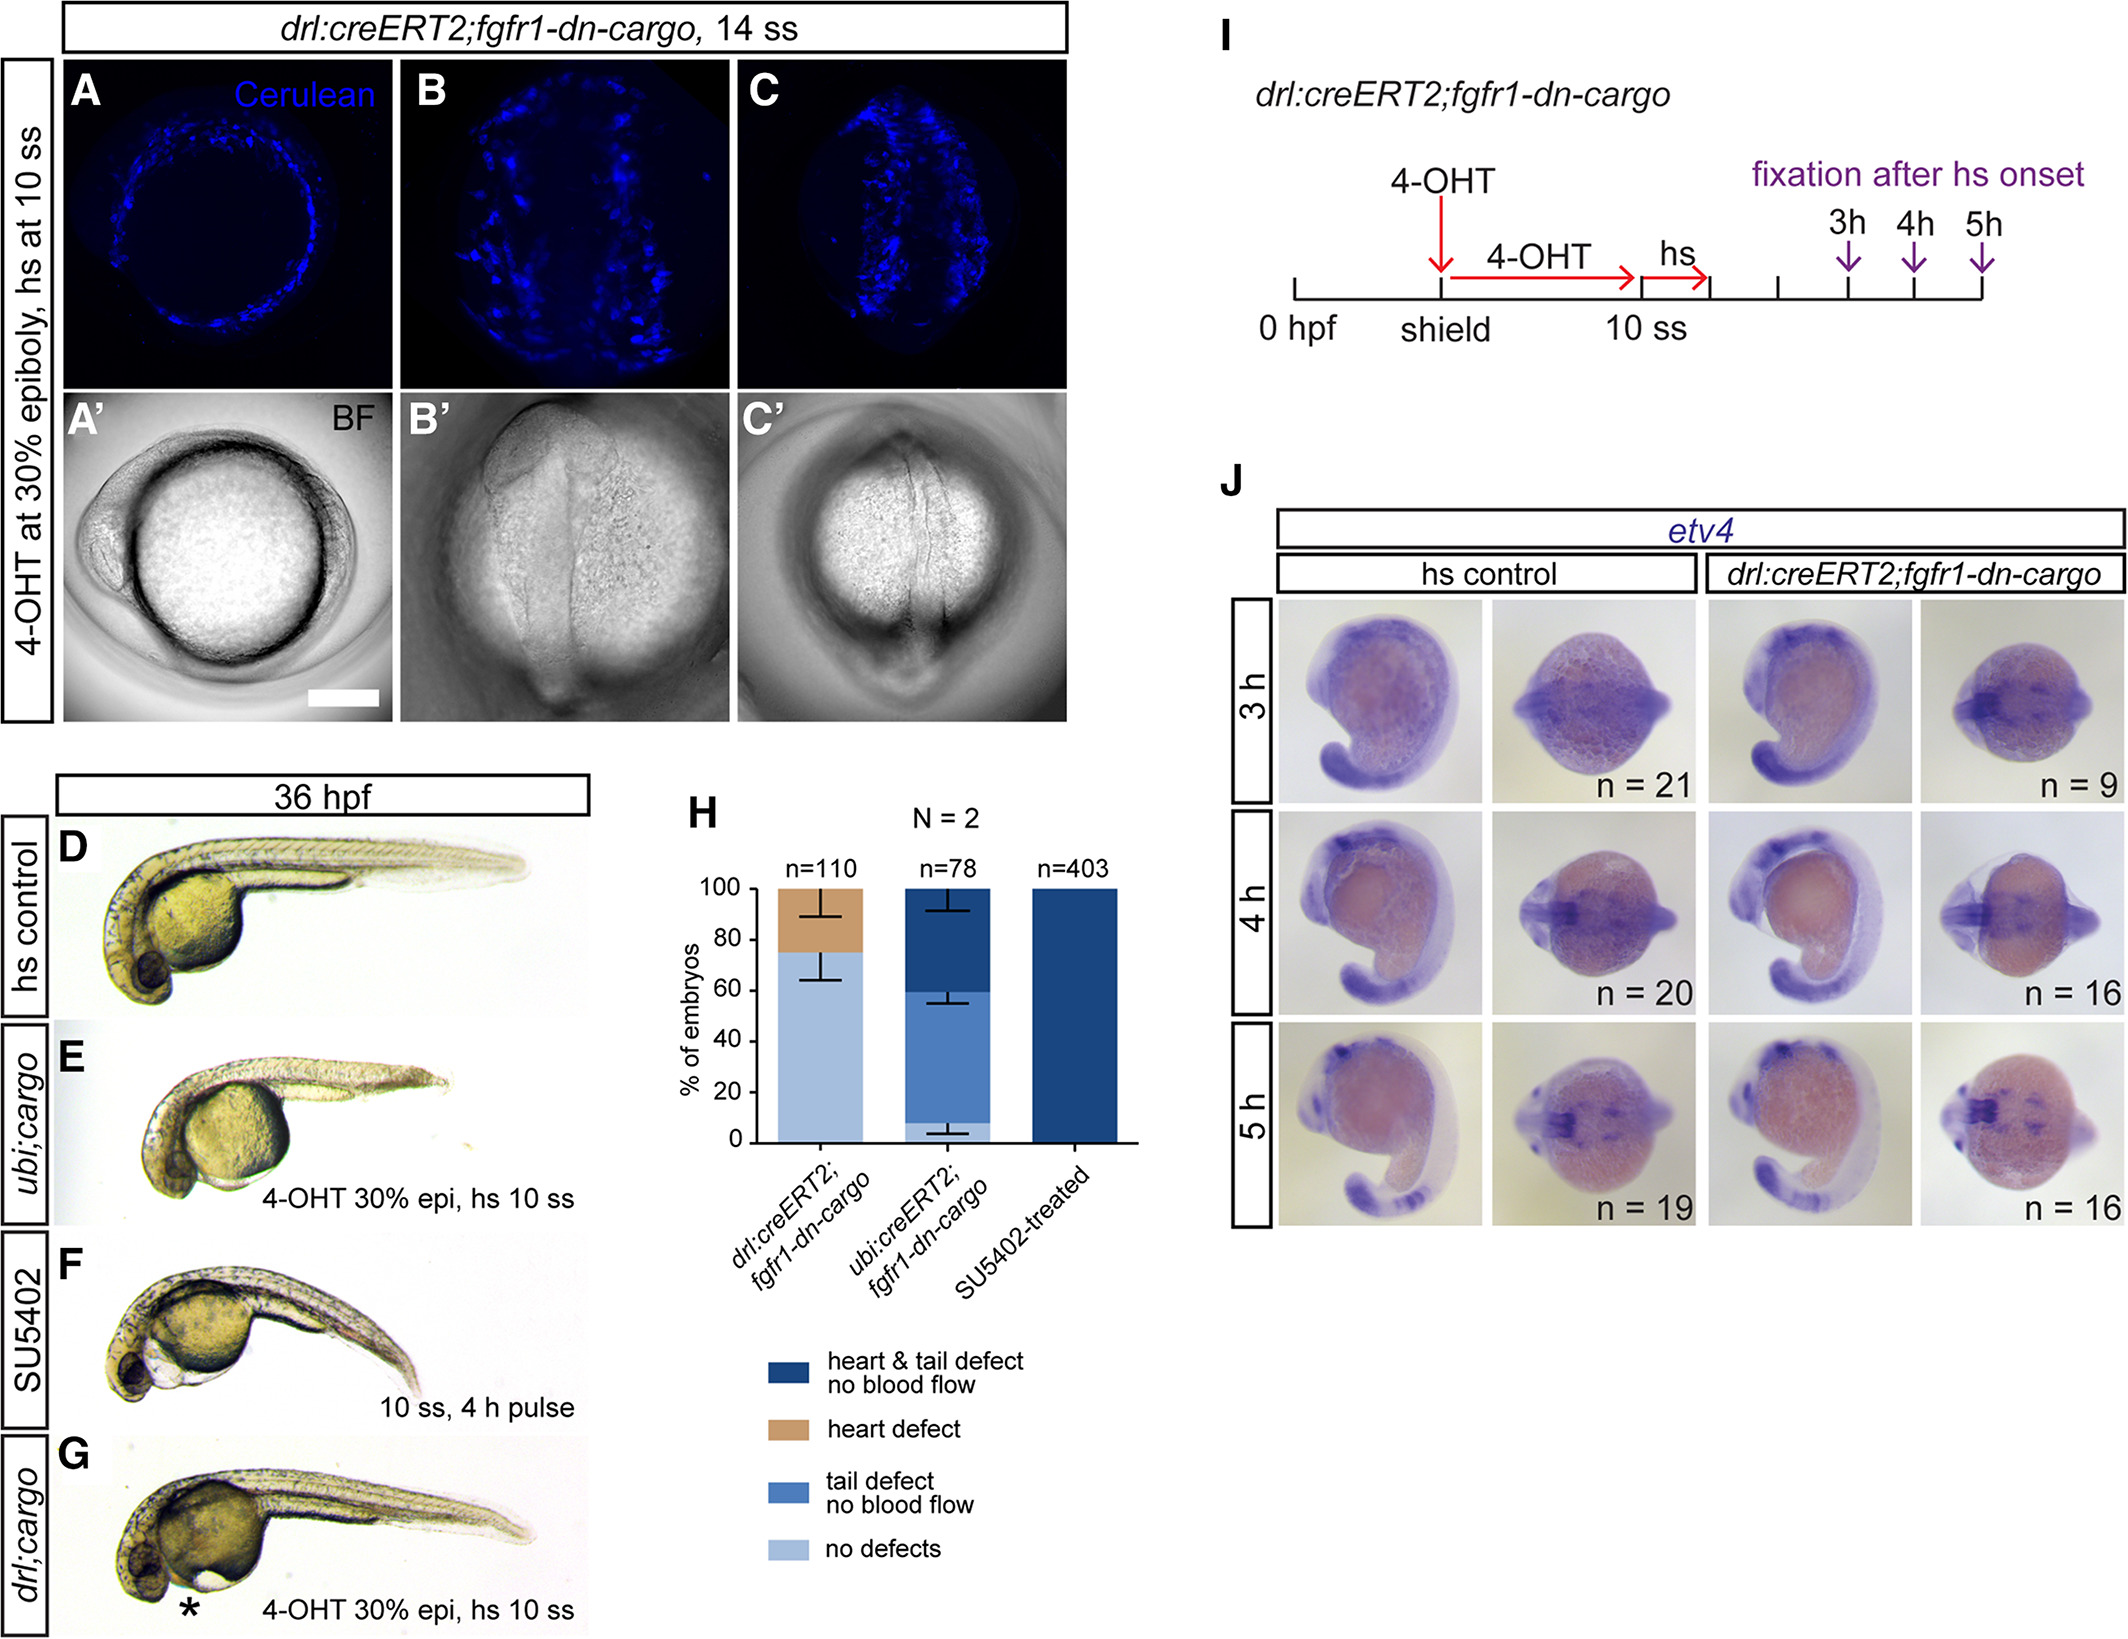
Fig. 4
Tissue‐specific FGF signaling perturbation in the developing LPM. A–C: Maximum‐intensity projection and brightfield images of an in toto SPIM‐imaged drl:creERT2;fgfr1‐dn‐cargo double‐transgenic embryo. The cell membrane of all Fgfr1a‐dn–expressing cells is fluorescently labeled with Cerulean‐CAAX after heatshock treatment, revealing mosaic transgene expression throughout the developing LPM; (A) lateral view, anterior to the top; (B) dorsal view of the anterior embryo, anterior to the top; (C) dorsal view of the posterior embryo, anterior to the top. D–G: Brightfield images of global or tissue‐specific FGF signaling–perturbed embryos, lateral views, anterior to the left. E,F: Ubiquitously Fgfr1‐dn–expressing or SU5402‐treated embryos show severe cardiovascular defects accompanied by body axis shortening and defects in posterior tail formation. G: Selective cardiovascular phenotypes (asterisk) with no apparent body axis deformations are apparent after tissue‐specific FGF signaling perturbation in drl–expressing descendants. H: Quantifications of phenotypes observed after drl:creERT2;fgfr1‐dn‐cargo‐, ubi:creERT2;fgfr1‐dn‐cargo‐, or SU5402‐mediated FGF signaling inhibition. Number “n” indicates the number of individual embryos analyzed per condition; “N” indicates the number of individual experiments performed. I–J: Embryo‐wide FGF target gene expression remains grossly intact upon LPM‐specific FGF signaling perturbation. I: Schematic showing the time line of treatments for genetic FGF signaling perturbations in drl:creERT2;fgfr1‐dn‐cargo and time points of embryo fixation for signaling activity readouts. Red arrows indicate time points and duration of 4‐OHT and heatshock treatments; violet arrows mark time points of embryo fixation after initiation of transgene activation via heatshock. J: Embryos selectively perturbed for FGF signaling in the drl descendants at somitogenesis displayed no detectable differences in etv4 expression when compared to unperturbed siblings 3–5 hr after heatshock treatment (lateral and dorsal views, anterior to the left). Number “n” indicates number of individual embryos analyzed for each condition.