
IMAGE
Fig. 4
- ID
- ZDB-IMAGE-180406-15
- Genes
- Publication
- Takada et al., 2017 - Re-evaluating functional landscape of the cardiovascular system during development
- All Figures
- Figures for Takada et al., 2017
Image
|
Figure Caption
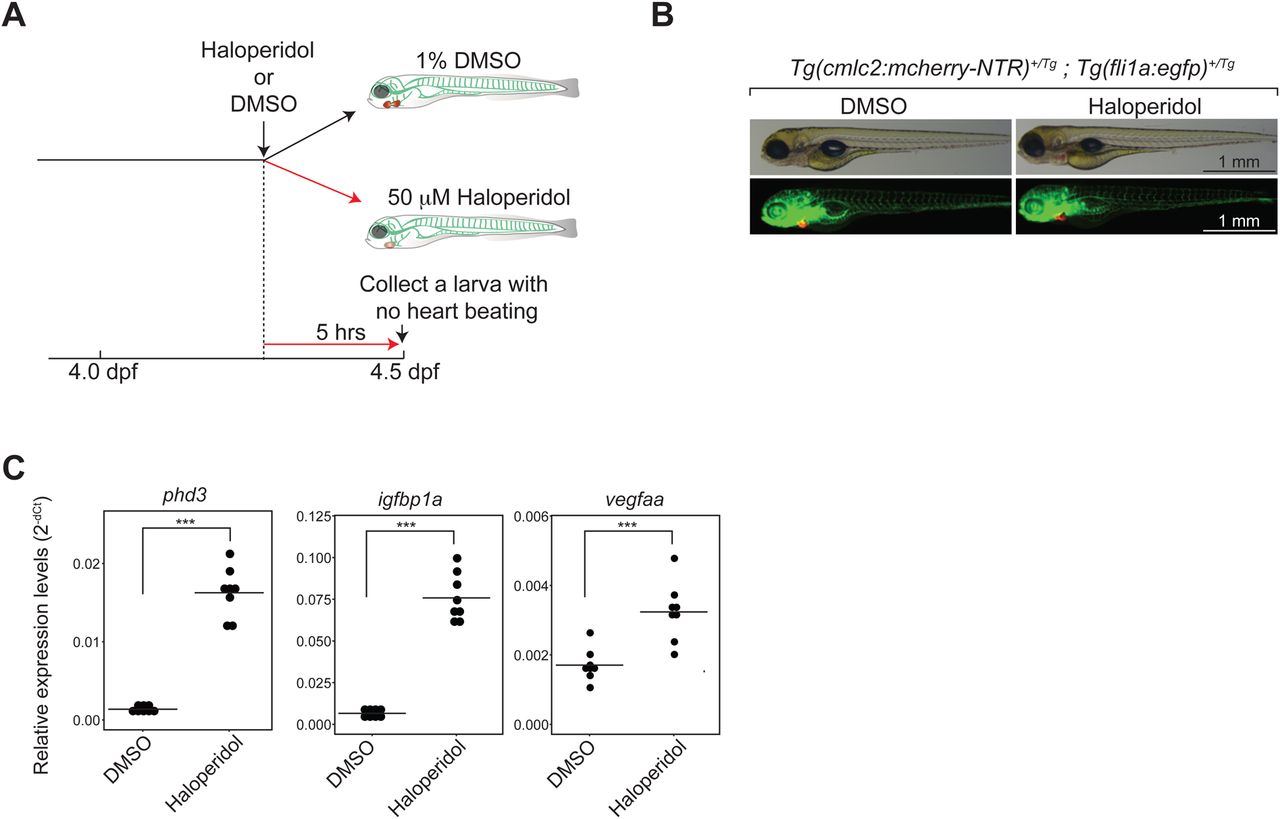
Fig. 4
Characterization of a cardiotoxin-treated model. (A). Schematic description of a cardiotoxin-treated model and the experimental strategy. (B). Presence of cardiomyocytes and hematovascular cells in the model. Green, hematovascular cells; red, cardiomyocytes. Scale bars: 1 mm. (C). qRT-PCR analysis of pan-hypoxia indicator genes. ***P<0.001. Student’s t-test. n=8 (DMSO-treated control), 8 (Haloperidol-treated).
Figure Data
Acknowledgments
This image is the copyrighted work of the attributed author or publisher, and
ZFIN has permission only to display this image to its users.
Additional permissions should be obtained from the applicable author or publisher of the image.
Full text @ Biol. Open