
Image
|
Figure Caption
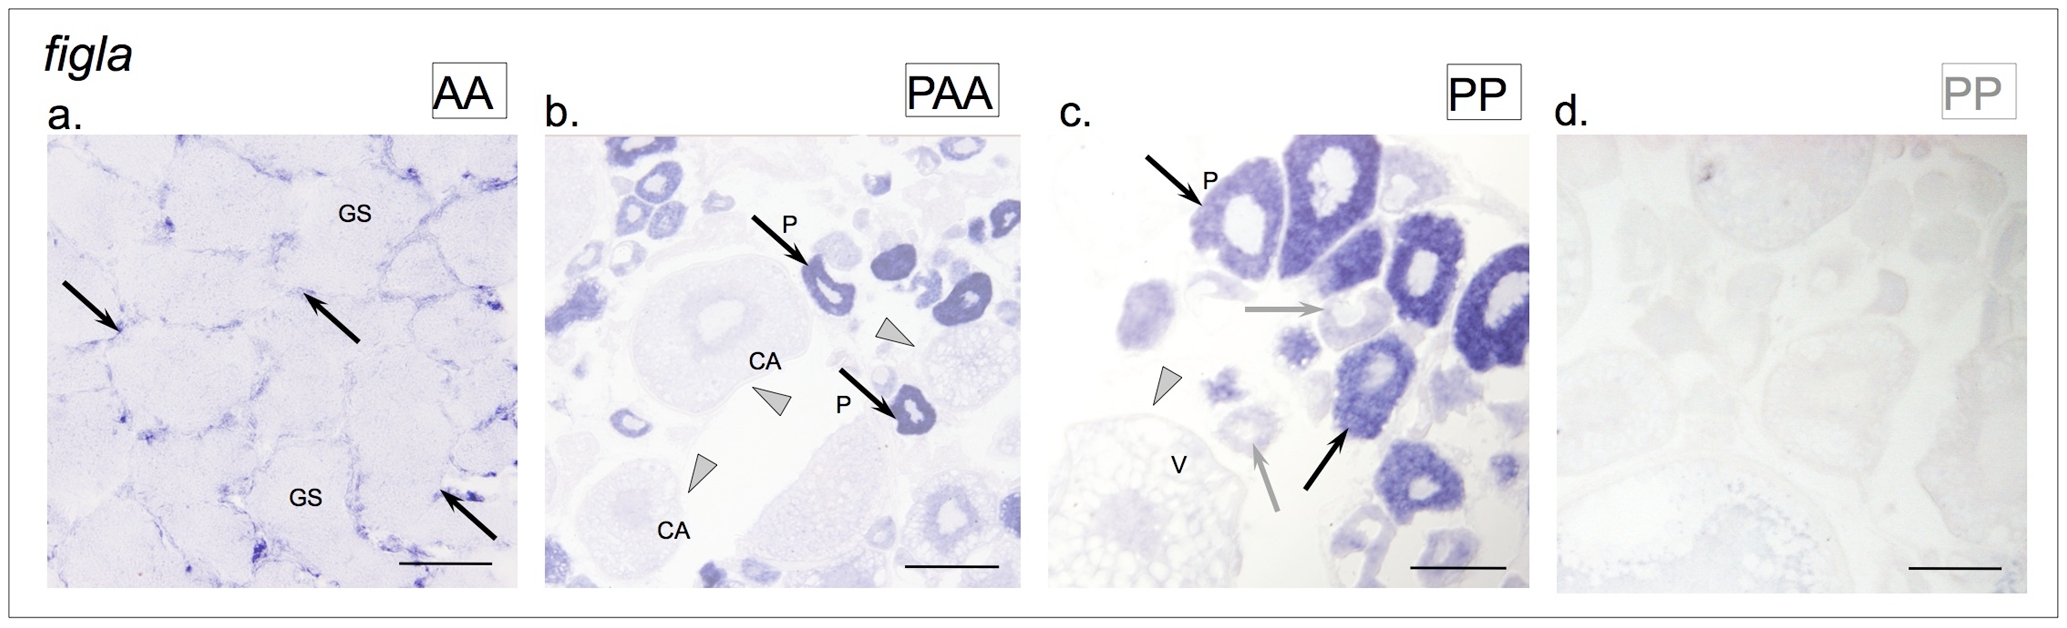
Fig. 6
(a) S. alburnoides (AA genotype) testis; (b) S. alburnoides (PAA genotype) ovary and S. pyrenaicus (PP genotype) ovary with (c) antisense and (d) sense probes (positive signals in primary oocytes exemplified with black arrows; lower expression in early stage oocytes exemplified with grey arrows; cells in different maturation stages, not expressing the transcript are indicated by grey arrowheads). Germ cells (GS), early perinuclear (P), cortical alveolar (CA) and vitellogenic (V) oocytes. Scale bar = 100 μm (a, c, d); scale bar = 200 μm (b).
Acknowledgments
This image is the copyrighted work of the attributed author or publisher, and
ZFIN has permission only to display this image to its users.
Additional permissions should be obtained from the applicable author or publisher of the image.
Full text @ PLoS One