
Fig. 5
- ID
- ZDB-FIG-240918-98
- Publication
- Levic et al., 2024 - TNF Promoter Hypomethylation Is Associated With Mucosal Inflammation in IBD and Anti-TNF Response
- Other Figures
- All Figure Page
- Back to All Figure Page
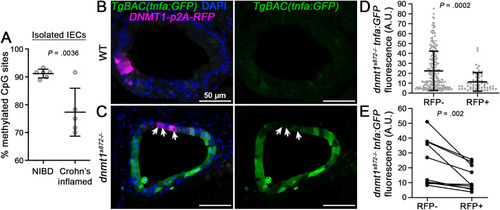
TNF hypomethylation of IECs is associated with inflammation and increased IEC TNF expression. (A) TNF methylation analysis of FACS isolated IECs obtained from bowel resections of non-IBD (NIBD) controls and inflamed CD cases. Data points are average methylation values from individual cases and controls (NIBD, n = 6 samples; Crohn’s inflamed, n = 5 samples). Mean ± SD are plotted. (B and C) 1-cell stage dnmt1s872 zebrafish mutants and WT siblings expressing TgBAC(tnfa:GFP)pd1028 as an inflammation reporter were injected with transgenic constructs to mosaically express human DNMT1-p2A-RFP specifically in IECs. At 5 days postfertilization (dpf), transverse sections of the intestine were collected and imaged by confocal microscopy. Arrows point to sparsely labeled RFP + cells expressing DNMT1 in dnmt1s872 mutants. Scale bars are 50 μm. (D) Quantification of tnfa:GFP expression in dnmt1s872 mutants (n = 217 [RFP-] and 57 [RFP+] IECs from 10 larvae). Mean ± SD are plotted. (E) Quantification of tnfa:GFP expression in dnmt1s872 mutants from paired RFP- and RFP+ IECs from individual tissue sections (n = 10 larvae). P values were calculated using nonparametric Wilcoxon 2-sample tests (A and D) or a Wilcoxon matched-pairs signed rank test (E). CD, Crohn’s disease; FACS, fluorescence-activated cell sorting; IBD, inflammatory bowel disease; IECs, intestinal epithelial cells; SD, standard deviation; TNF, tumor necrosis factor. |