
FIGURE
Fig 7
- ID
- ZDB-FIG-240524-108
- Publication
- Salazar et al., 2024 - Epigenetic and physiological alterations in zebrafish subjected to hypergravity
- Other Figures
- All Figure Page
- Back to All Figure Page
Fig 7
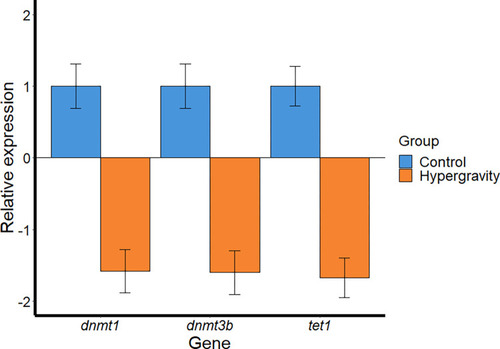
Expression of three epigenetic-related genes in zebrafish larvae after 5 days of ~3 Data are shown as mean ± SEM of fold change Relative Expression = 2^(-ΔCt) using control values set at 1. N = 10 larvae per group (control and hypergravity). No significant differences were found. |
Expression Data
Expression Detail
Antibody Labeling
Phenotype Data
Phenotype Detail
Acknowledgments
This image is the copyrighted work of the attributed author or publisher, and
ZFIN has permission only to display this image to its users.
Additional permissions should be obtained from the applicable author or publisher of the image.
Full text @ PLoS One