
Fig. 8
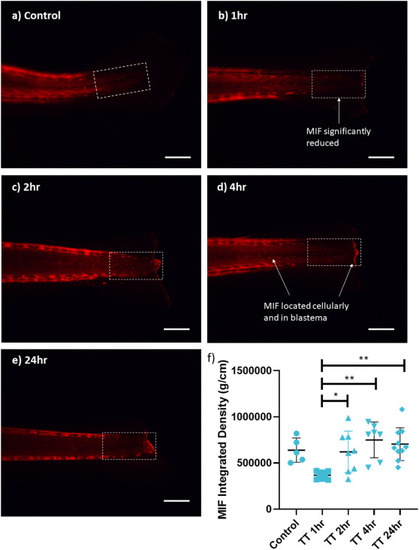
Representative immunofluorescence images depicting the macrophage migration inhibitory factor (MIF) response to tailfin transection in zebrafish larvae in a) controls, b) 1hr, c) 2hr, d) 4hr, and e) 24hr post injury. Quantified data and statistical results are presented in frame f (colour correlates to protein depiction in Fig. 9). Graph represents integrated density fluorescent intensity measurements of the defined area of the tailfin. Data are presented as mean ± SEM. *p < 0.05; **p < 0.01. Scale bar represents 100 μm. (For interpretation of the references to colour in this figure legend, the reader is referred to the Web version of this article.) |